
US Dollar Talking Points:
- The US Dollar has snapped back after this morning’s data: Consumer confidence printed at 106 against a 116 expectation and a 117-prior print, while Jolts job openings showed a stark decline in the number of open jobs. These aren’t usually high impact releases, but they sure did catch the attention of markets as it’s helped to craft a pullback in the USD to go along with a breakout move in equities.
- There’s more data for this week with the Fed’s preferred inflation gauge of PCE set to release on Thursday and then Non-farm Payrolls on Friday, which speak to both inflation and employment. This will be the last of each of those releases that we or the Fed get to see before the September rate decision, and after this morning, probabilities for another hike have pulled back.
- This is an archived webinar that’s free for all to join. If you would like to join the weekly webinar on Tuesdays at 1PM ET, the following link will allow for registration: Click here to register.
The US Dollar has snapped back today after a couple of surprising prints produced more run than they normally would. Coming into the morning the US Dollar was testing the 104.31 level again, which had helped to hold the highs last Friday. The USD/JPY move was especially strong as the pair was trading at a fresh 2023 high as the US opened for trade this morning.
But at 10 AM the US Dollar got hit by two separate pieces of data: The Consumer Confidence release came in well-below expectations, printing at 106 against an expectation for 116 and a prior print of 117. This is often looked at as a leading indicator and as the world attempts to assess impact from the global rate hike regime of the past year and a half, those leading reports have caught even more attention than usual. Also at 10 AM we had the release of Jolts job openings, which showed a massive drop in the number of open positions. And this speaks to not only weakness in the labor market, but also the leading quality as businesses looking to hire less will often come along with bearish opinions about economic prospects.
So far on the daily bar, this has produced a strong pullback in the bullish USD theme, and this daily candle is looking very similar to last Wednesday’s, which was helped along by a batch of disappointing PMI prints. This produced a bearish pin bar on the daily chart last Wednesday, but support caught on Thursday at 103.27 and that held the higher-low before a bullish outside bar printed which led to continuation and a fresh two month high on Friday.
The theme for today’s webinar was a quote from John Templeton, where he said: “The time of maximum pessimism is the best time to buy, and the time of maximum optimism is the best time to sell.”
This is a relative statement, of course, but it speaks to contrarianism, and the fact that chasing a trend can lead to unsavory results. But looking for those pullback themes in the trend, that can be a different story, as a short-term basis can show pessimism in what was otherwise a bullish scenario, and this would be a short-term bearish theme in a bigger picture bullish trend. And more important for trend construction (in the opinion of many) is not what bulls do at highs, but how they react at relative lows or on tests of supports. This is what can lead to higher-lows and bullish continuation, like what showed in the back-half of last week.
And we have a similar such scenario now, as a counter-trend move is pricing into the DXY. This isn’t to say that bulls can’t fail because they most certainly can, such as we saw bears fail to hold the trend after the breakdown in July. The quality of the trend can be seen during pullbacks with how market participants respond, and that’s where we’re at now with the US Dollar, particularly with those heavy data releases coming out later this week.
In DXY, the level that I focused on in the webinar is 103.45 as this was confluent. It was a swing low last December that’s continued to carry impact, and it’s also confluent with a bearish trendline connecting March and May swing highs. Below that, we have the familiar level of 103.27, which can keep the door open for bulls. But below that questions begin to arise on bullish trend scenarios and the big spot for that test is 102.85-103.00, and if bulls fail to defend that then the look goes lower, to 102.45-102.60. At that point there could even be bearish potential with a lower-high around that 102.85-103.00 spot.
On the topside of price action, key resistance has already availed itself at 104.31 and that’s the spot for bulls to beat to continue the move. After that, we have the May swing high at 104.70 and then the big figure at 105 which is also the 38.2% retracement of the 2021-2022 major move.
US Dollar - DXY Daily Price Chart (indicative only, not available on Forex.com platforms)
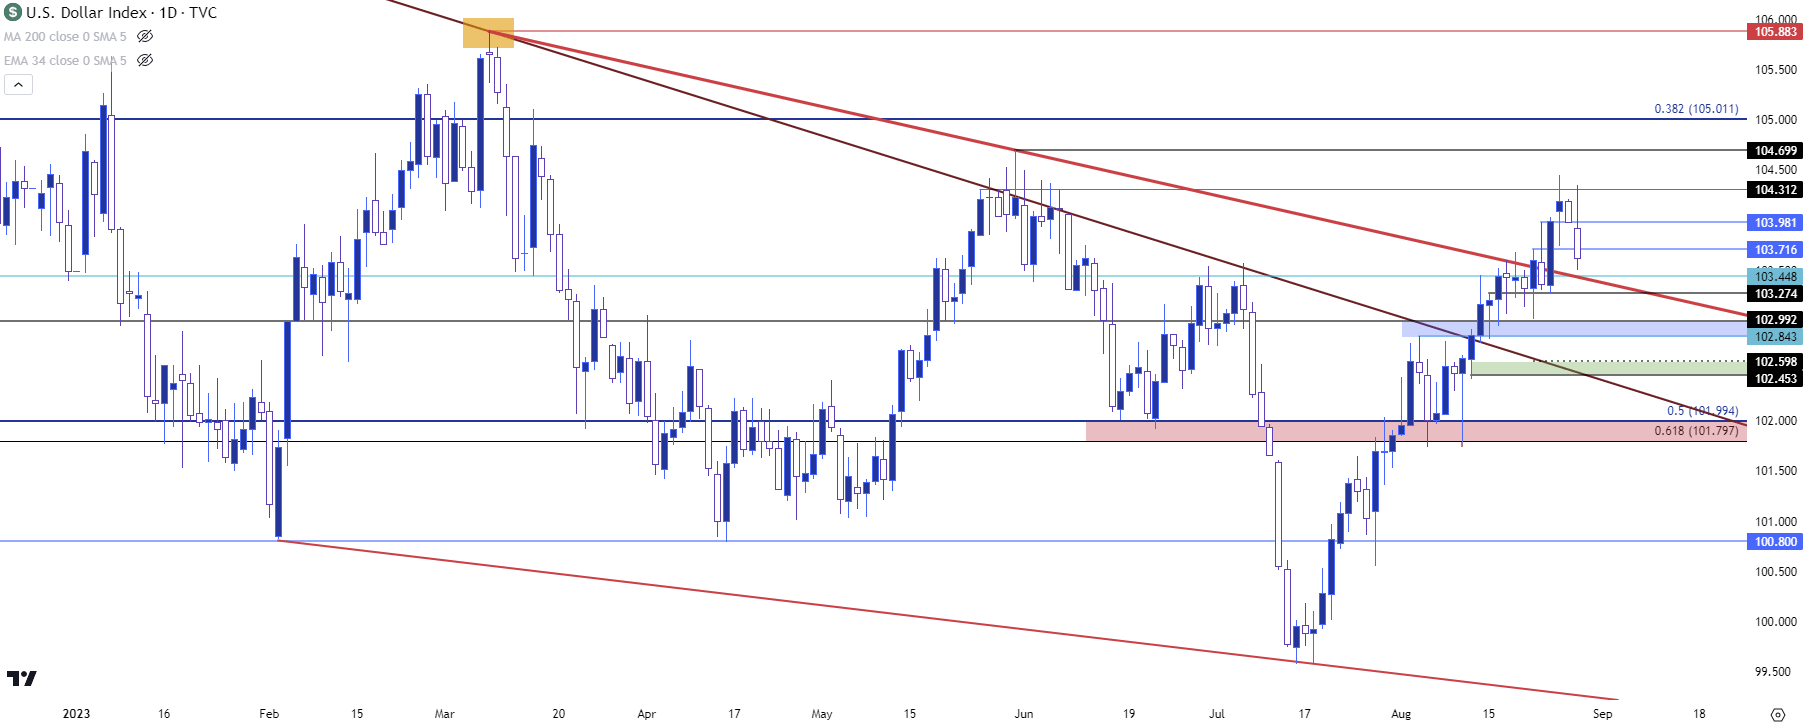
Chart prepared by James Stanley; data derived from Tradingview
EUR/USD
European data took a turn for the worse in July and it started to look bleak for the European Central Bank’s continue rising rate regime. But the data of recent hasn’t been as bad and there’s been building hopes that the ECB might have another hike left.
I spent a good deal of time talking about this during the webinar but at this point bulls have an open door to push a pullback in the pair. The 1.0845 level has remained important, as this held the highs on Friday and was confluent with resistance in a falling wedge today. That led to a breakout that brought on some run and we now have a fresh short-term higher-high. The question is whether this move can extend, and there’s a couple of spots of longer-term resistance potential from around 1.0900 and then 1.0943 that remain of interest for bearish trend scenarios in the pair.
EUR/USD Daily Price Chart
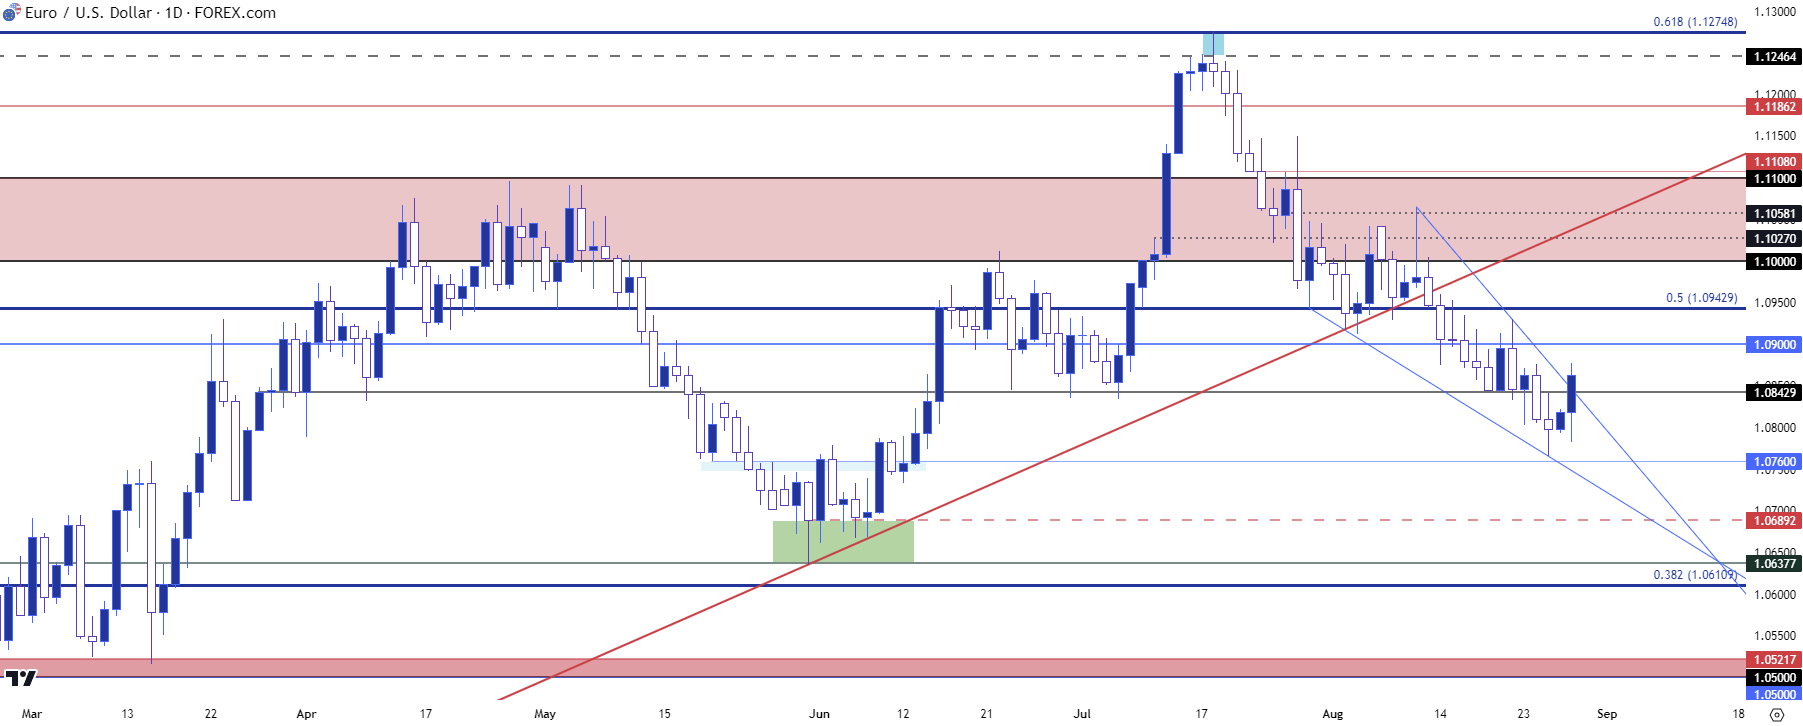
Chart prepared by James Stanley, EUR/USD on Tradingview
USD/JPY
Today’s pullback theme is quite evident in USD/JPY, which had started the day by jumping up to a fresh 2023 high. I also spent a good amount of time discussing this in the webinar, highlighting the roll of carry in this scenario.
This highlights higher-low support potential at the 145 psychological level and there’s another spot of shorter-term interest around 145.68. The daily bar is currently showing as a bearish outside day which can keep the near-term focus on downside themes, but the bigger question is how/if bulls respond to re-tests of support at that 145 level.
USD/JPY Daily Price Chart
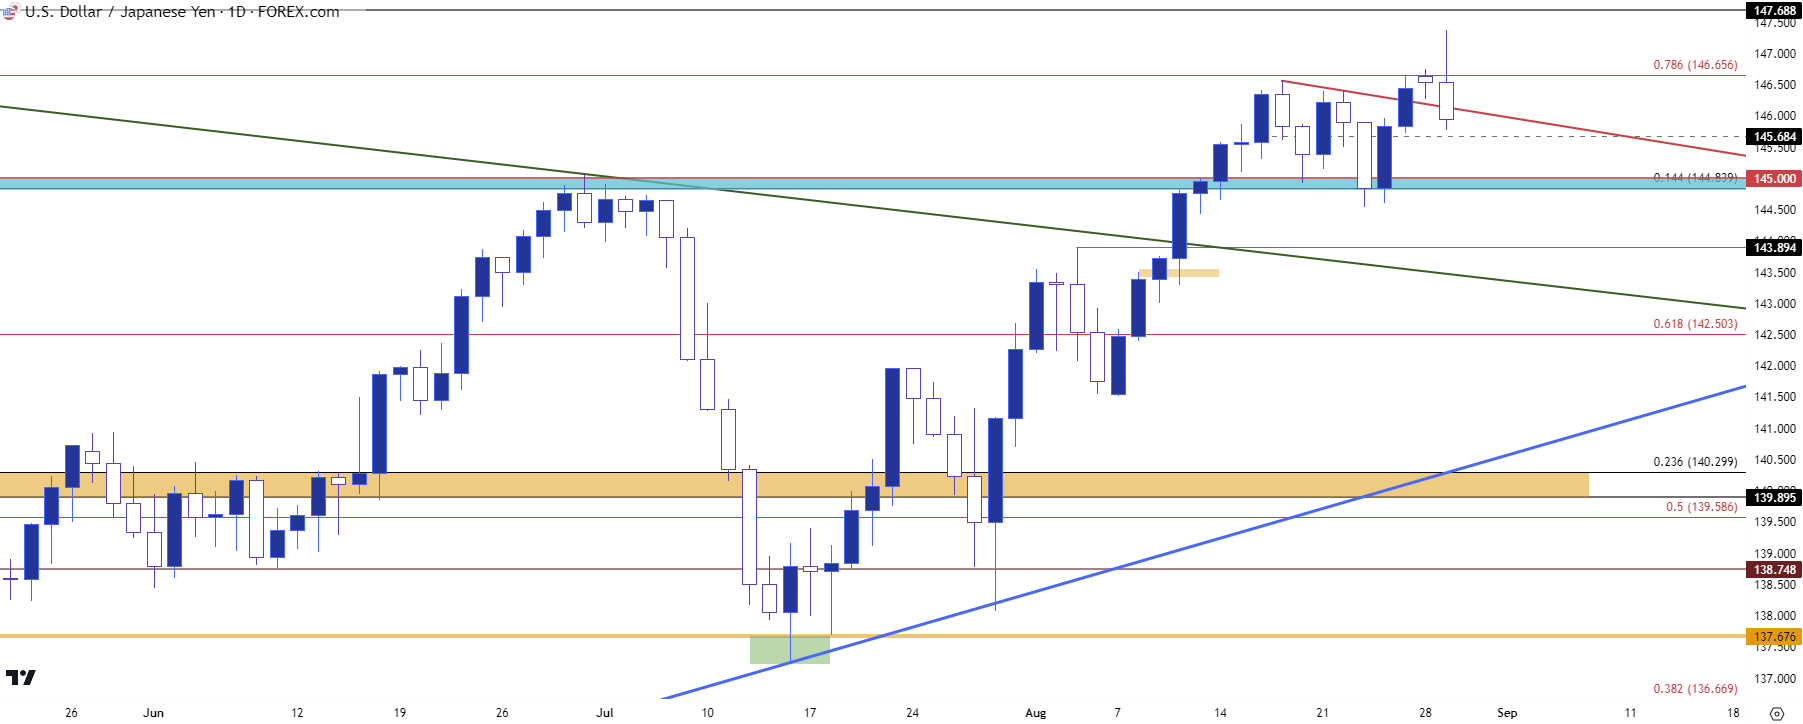
Chart prepared by James Stanley, USD/JPY on Tradingview
USD/CAD
While the US Dollar is putting in a sizable pullback on the day, USD/CAD has been more moderate as price is still holding support around the same level that was in-play as support on Monday, which was prior resistance from last Thursday.
This illustrates the additional insertion of CAD-weakness into the matter and the USD/CAD chart, in my opinion, looks like a hyperbolic version of the USD chart over the past month given that extra push from CAD bears in the pair.
This could keep USD/CAD as one of the more attractive pairs for scenarios of USD-strength, and that 1.3500 level remains of interest for support potential if we do see this pullback dig a bit deeper. On the resistance side of USD/CAD, the 1.3652 level looms large as this was a brick wall for bulls in both April and May, before sellers went on the attack in June.
USD/CAD Daily Price Chart
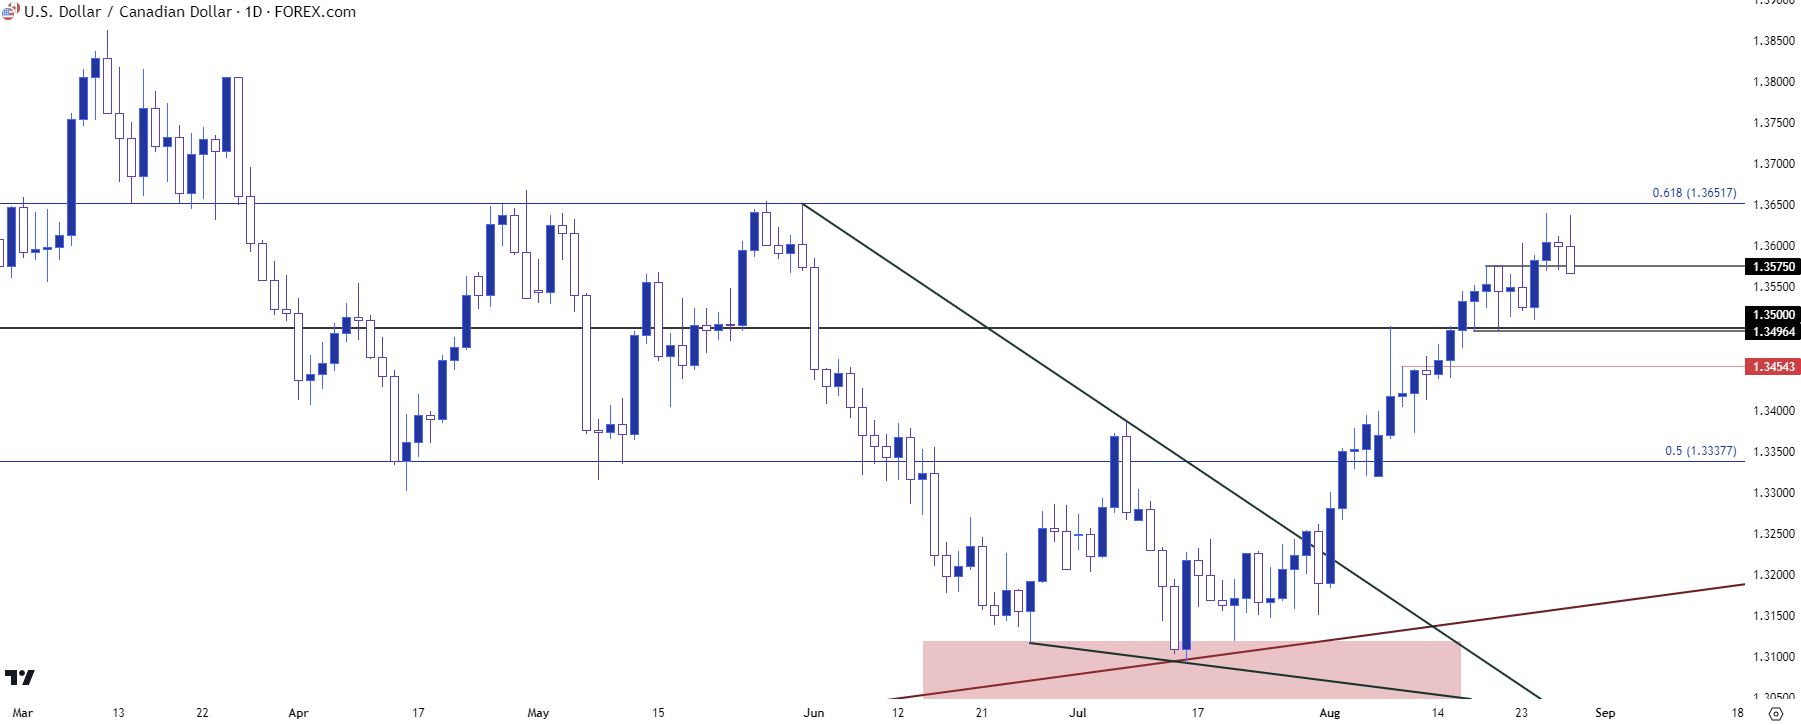
Chart prepared by James Stanley, USD/CAD on Tradingview
Gold
Towards the end of last week there were a lot of questions around Gold as both the US Dollar and Gold had shown strength on the weekly candle. And while an inverse or counter relationship is common, Gold and USD can express direct correlation at times, too, and the big question then is often what’s happening with other currencies.
We looked at Gold last week in the webinar, highlighting the initial breach of a falling wedge pattern combined with a re-test of the Fibonacci level at 1903. I had also highlighted follow-through resistance potential at 1910 and then the 1925-1932 zone.
We’re now trading above the 1932 zone and bulls have open scope for continuation given the series of higher-highs and higher-lows. During the webinar I spotted some specific levels to follow for themes of bullish continuation and that 1925 level, combined with prior resistance structure at 1910 and 1903 now become of interest for directional themes.
Gold (XAU/USD) Four-Hour Price Chart
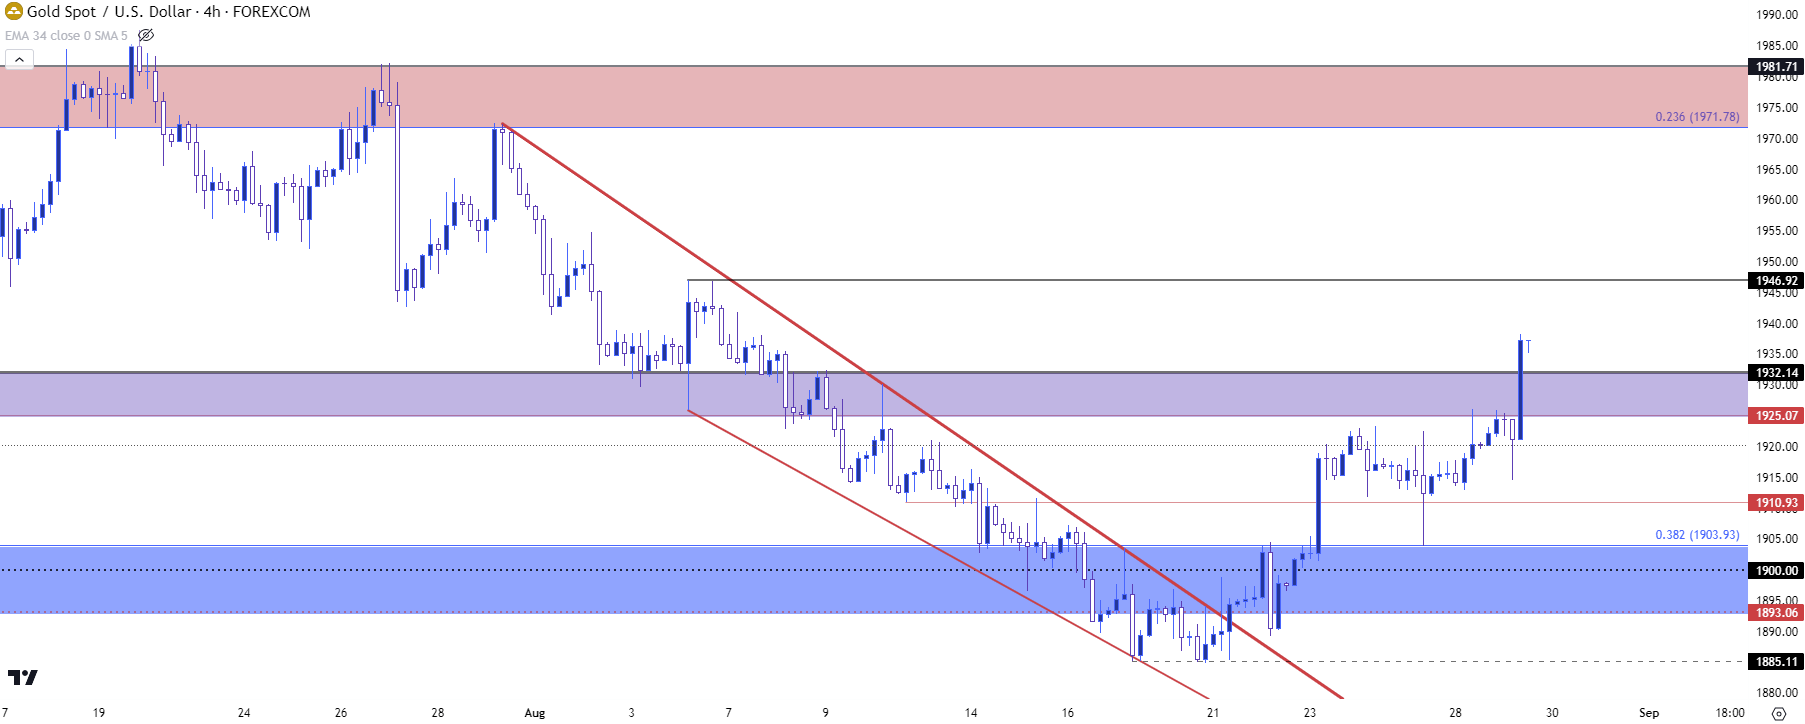
Chart prepared by James Stanley, Gold on Tradingview
SPX
It was a brutal month of August for stocks. Until the past week or so, that is. While USD strength has coincided with a change of pace for equities, the big question now is whether the strength showing is related to end of month dynamics or whether there’s a bullish response forming, helped along by weaker US data and the prospect that the Fed may not hike again this year.
In the S&P 500, the month of August brought lower-lows and lower-highs for the first time since March. And March, of course, is when the banking crisis brought along the idea that the Fed may be done with hikes as regional banks in the US remained on their back foot.
We’ve had two rate hikes since then, but it wasn’t until we came into August with continued strength in US data that this started to get more attention as there’s now expectations that GDP may grow by 5.9% per the Atlanta Fed GDPNow model, which suggests that the Fed may not yet be done.
This morning is more evidence of the ‘bad is good’ theme, where bad economic data brings expectations for fewer rate hikes, which prods weakness in USD and strength in stocks. And the question around that is whether it continues with the Thursday release of PCE and the Friday release of Non-farm Payrolls. In S&P 500 futures, Friday was a higher-low and this morning brings a higher-high, which invalidates the bearish engulfing pattern from last Thursday. The test now is at the 4500 psychological level and there’s now bullish structure for buyers to defend, with supports at 4485, 4467 and 4447.
S&P 500 Four-Hour Price Chart (indicative only, not available on Forex.com platforms)
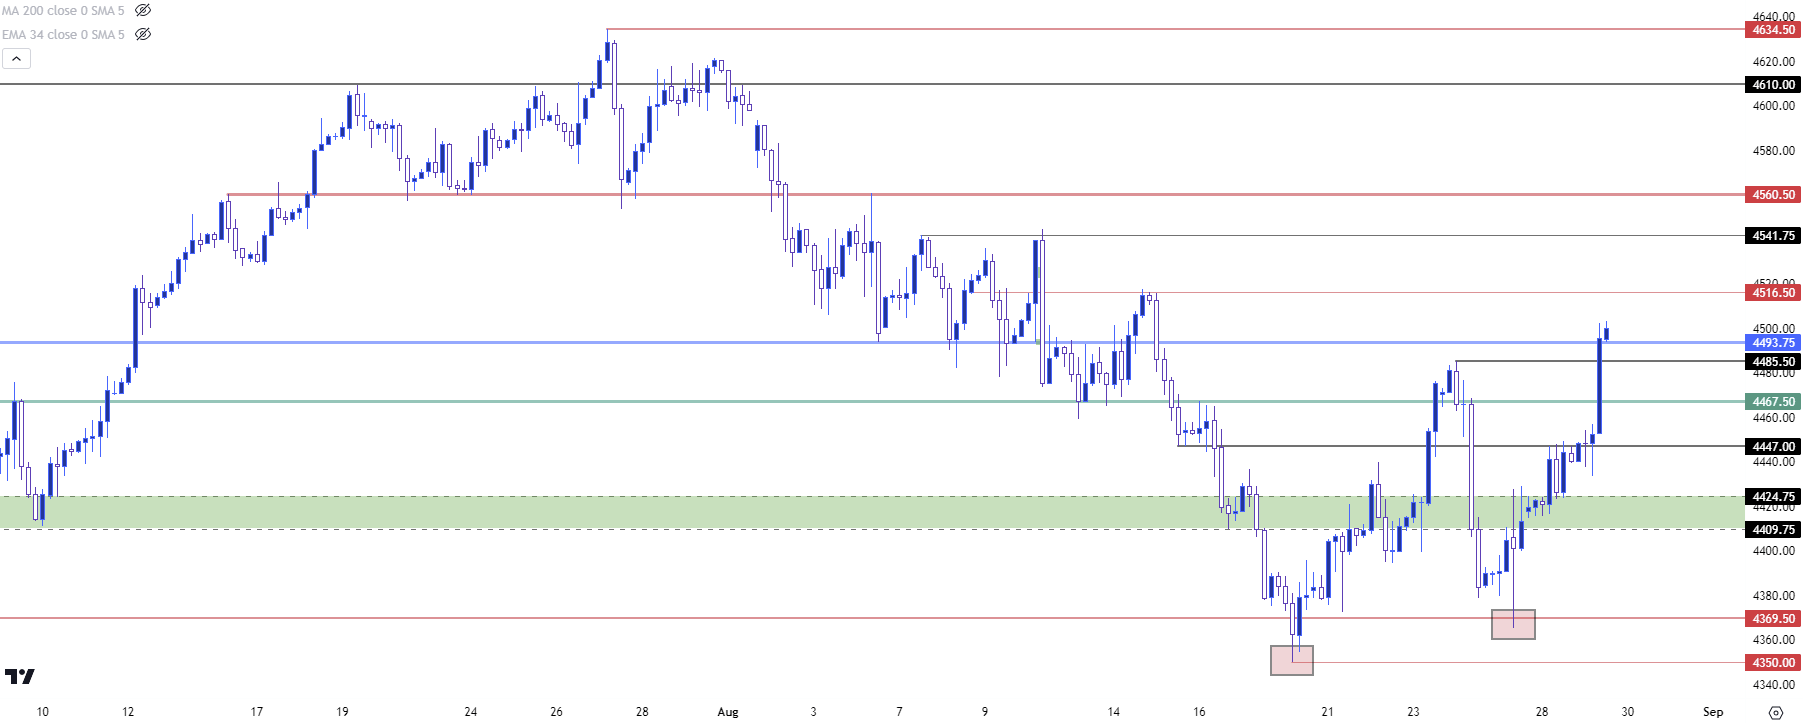
Chart prepared by James Stanley; data derived from Tradingview
--- written by James Stanley, Senior Strategist


