
US Dollar Talking Points:
- The US Dollar is sitting at a fresh five month high this morning with a major spot of resistance sitting overhead at 105.
- The support response last week in the US Dollar was impressive, with the levels looked at in last Tuesday’s webinar coming into play at 103 on Wednesday and then 103.27 on Friday after the NFP report, which helped to hold a higher-low in the US Dollar. And in the early portion of this week more bearish European data has helped to continue that trend.
- This is an archived webinar that’s free for all to join. If you would like to join the weekly webinar on Tuesdays at 1PM ET, the following link will allow for registration: Click here to register.
In last week’s webinar I used a quote from John Templeton as a theme, and that quote is as follows: “The time of maximum pessimism is the best time to buy, and the time of maximum optimism is the best time to sell.” As I qualified then, this is not a recommendation of any sort, but it does highlight the possible value of contrarianism, particularly when working with a trend.
When a bullish trend pulls back, especially if that trend had been running for some time, that’s when we can see pessimism creeping in. This is very similar to the backdrop we looked at in the US Dollar last Tuesday, when the currency had held resistance at 104.31 and started to pullback. That pull back continued to run, but as I said last week the big test was going to be where bulls came in to support price.
The answer to that last week was less than 24 hours later when the 102.85-103.00 zone in DXY was tagged on Wednesday morning. This led to a bullish move that held through Thursday’s release of PCE data, but it was what happened on Friday that remains relevant today.
The Non-farm Payrolls report was issued at 8:30 AM ET and it was a slight beat on the headline number with a larger unemployment figure than what was expected. This is generally considered a negative and, in many cases, would come along with lessened potential for more rate hikes from the Fed as it’s an item of economic weakness to see the unemployment rate unexpectedly rise.
There was an initial reaction of weakness in the US Dollar, but very similar to what happened around the CPI print in August, that reaction merely pushed prices down to support after which bulls pounced.
US Dollar - DXY Four-Hour Price Chart (indicative only, not available on Forex.com platforms)
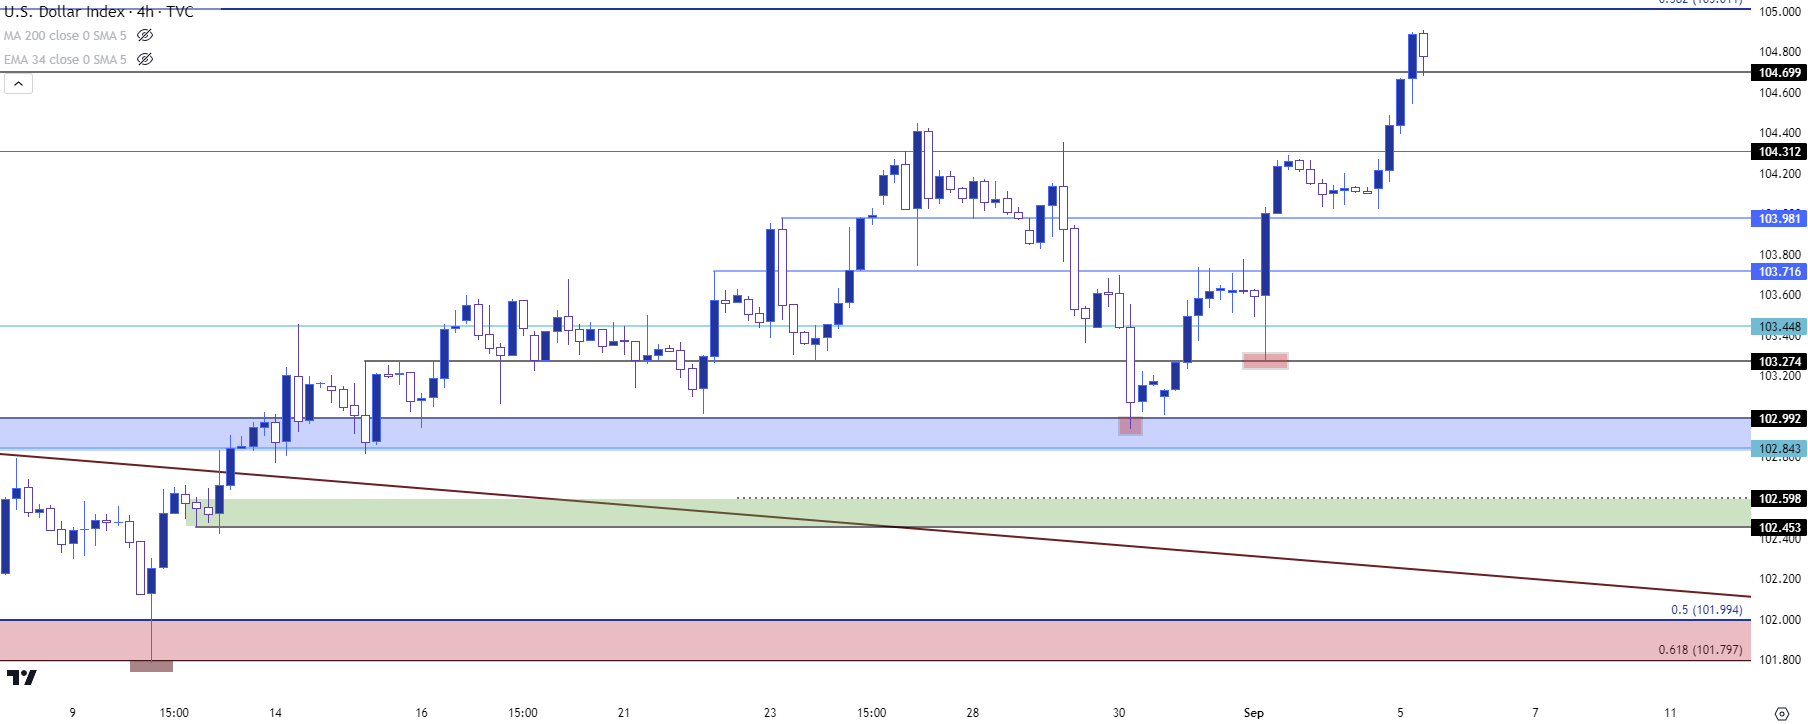
Chart prepared by James Stanley; data derived from Tradingview
When a market shrugs off bad news and runs on good news, that a clear illustration of bullish sentiment as buyers appear unphased by the negative news and, instead, use that as an opportunity to buy a higher-low. This is similar to the way that the US Dollar and DXY behaved in August after the release of CPI numbers, which were below expectation yet produced a bullish response in the Greenback.
And at this point there’s considerable support structure for bulls to defend after the reaction to that support last Friday morning. The prior five month high is at 104.70 and that’s being tested intra-day. A little lower, we have the 104.31 level that I had looked at for resistance last week. Below that, we have 103.98 and then 103.72. This is followed by 103.45 and even that could serve as a higher-low. But the big area for bulls to protect appears to be that 102.85-103.00 zone which came into play on Wednesday.
For resistance: The 105.00 level sitting overhead could be key as this is the 38.2% Fibonacci retracement of the 2021-2022 major move and this is the area that caught the highs in May. After that, we have the current 2023 high at 105.88.
Bigger picture, and connecting to the theme we discussed last week, is the fact that the US Dollar has gained for seven consecutive weeks on the weekly chart. This is rare, as six consecutive weekly gains has only happened six times in the past decade (including this most recent instance).
And with last week’s late reaction to support in USD, we had a 7th consecutive weekly gain which hasn’t happened since 2014. And in that instance the US Dollar bullish trend was in the early stages. The driver then? Weakness in Europe. The driver now? Appears to be weakness in Europe…
US Dollar - DXY Weekly Price Chart (indicative only, not available on Forex.com platforms)
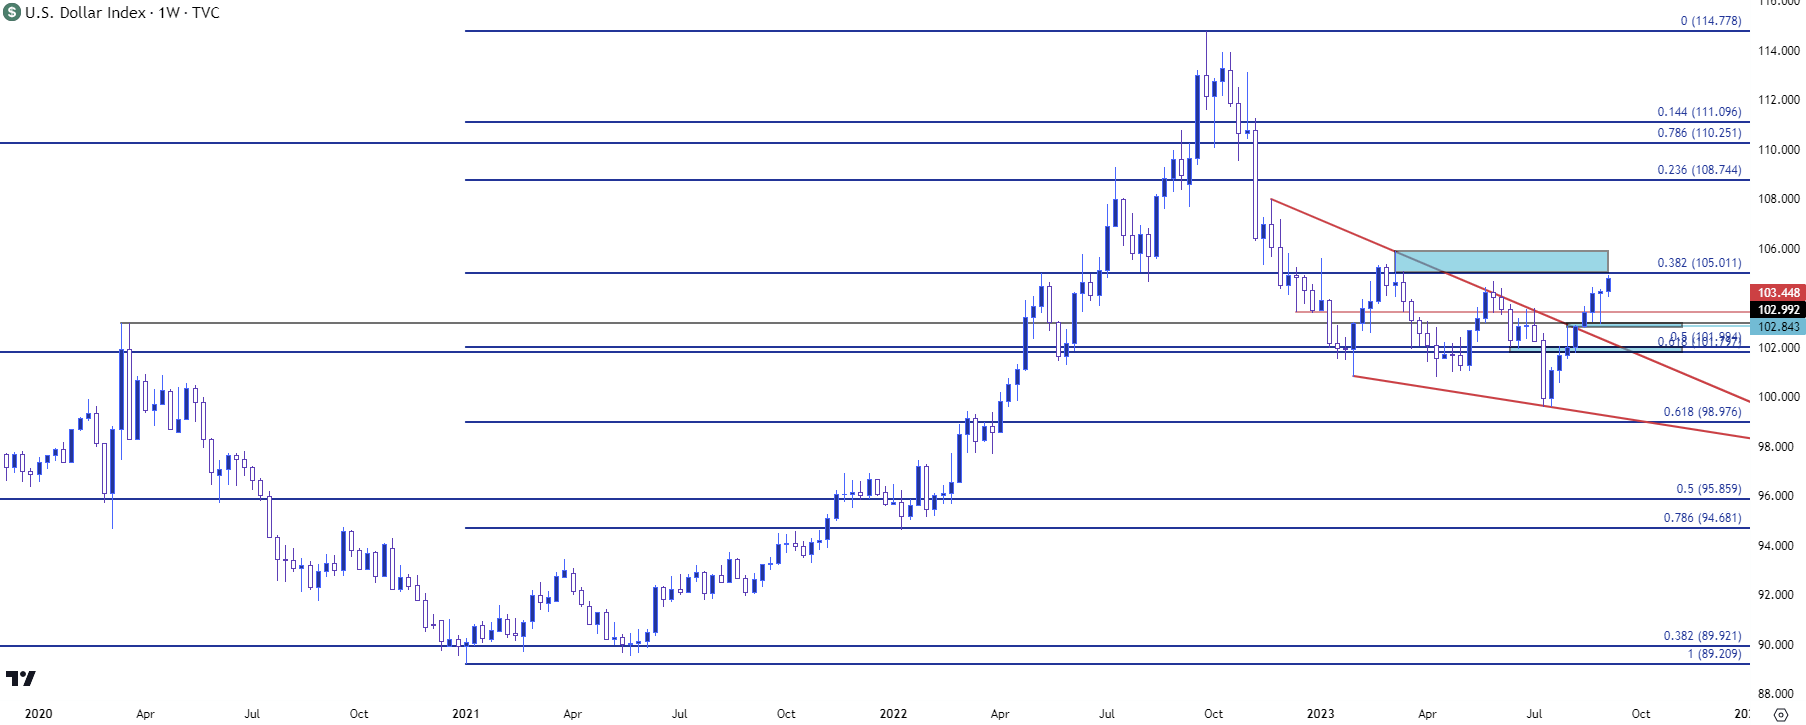
Chart prepared by James Stanley; data derived from Tradingview
EUR/USD
As I’ve been discussing of late, I think that a large portion of this bullish move in the USD is driven by weakness in the Euro and the European economy. The fact that both stocks and gold (until today) have held up well illustrates that fact. And given that the USD is just a composition of underlying currencies, there’s no reason that both gold and the USD can’t go up at the same time, particularly if there is some weakness in the Euro (which is 57.6% of DXY) getting priced in.
This morning’s economic calendar brought more negative European data in the form of PMIs out of Italy, Spain and Germany along with Eurozone PMI numbers. There was also the release of PPI which is the Producer Price Index and often thought to be a pre-cursor to consumer inflation. This showed a contraction of 7.6% on an annualized basis. This was another shot of weakness in the single currency which now sits at a fresh two-month-low and that helped to buoy the DXY move up to a fresh high.
In EUR/USD, the big question is whether a bearish trend might be able to take over, like what had showed last year. There’s a big support zone on the way that sits from 1.0611-1.0638. The 1.0611 level is particularly interesting, as this is the 38.2% Fibonacci retracement of the same major move from which the 61.8% marker caught the high almost perfectly in July.
The 50% marker of that same move has been in-play over the past few weeks and this helped to mark the high last week, just before that support response in the USD took over. The 38.2 of this move hasn’t been tested since March, and that’s around the time that the banking crisis in the US took over, helping to drive USD weakness along with equity and gold strength.
If sellers can push through that, the next major hurdle is the 1.0500 psychological level that was in-play as we came into this year.
EUR/USD Weekly Price Chart
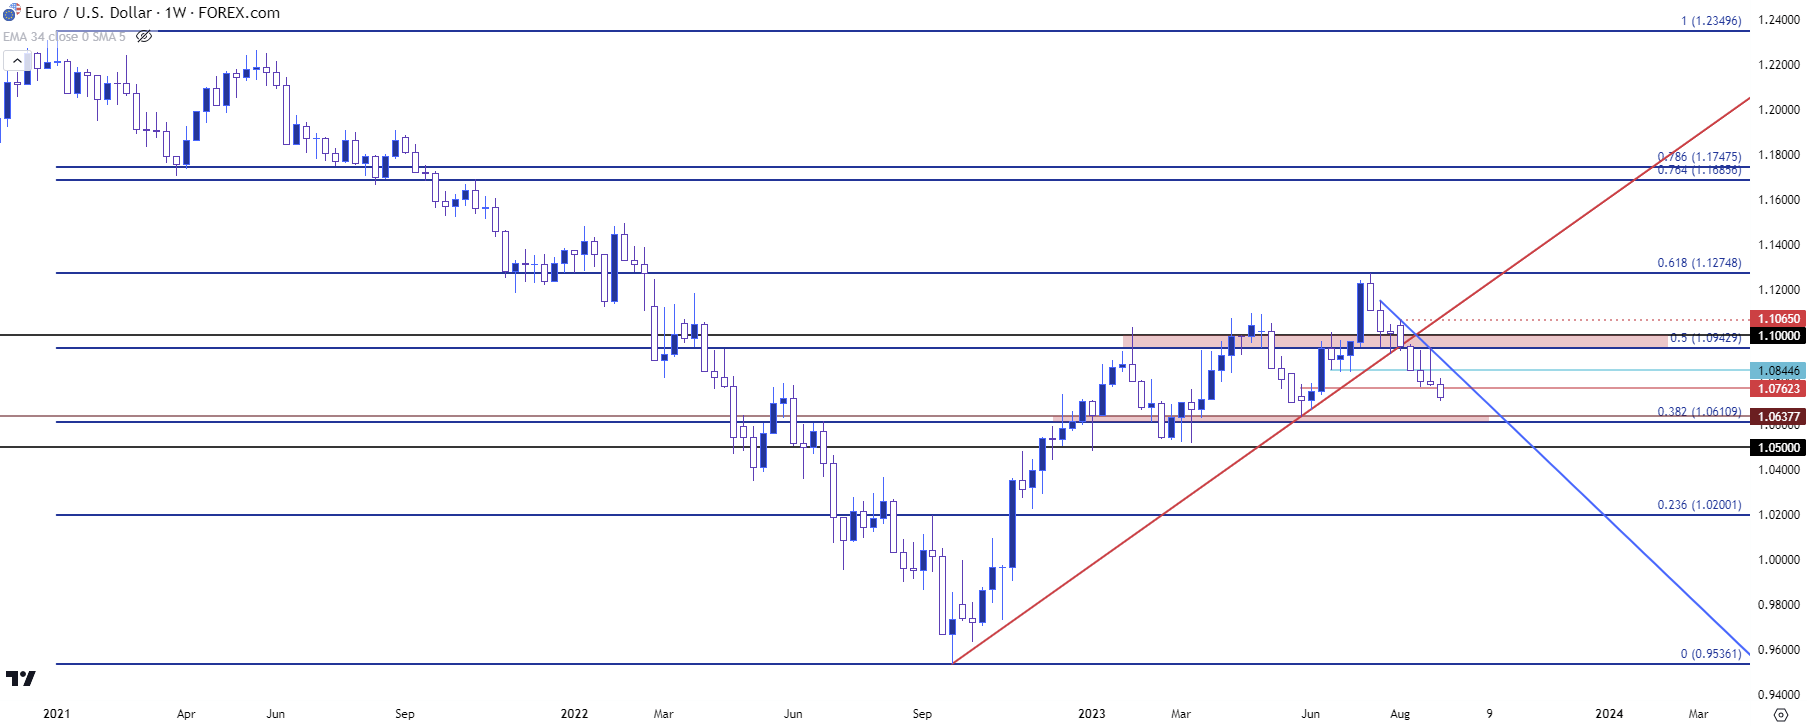
Chart prepared by James Stanley, EUR/USD on Tradingview
USD/JPY
I had remarked on the webinar that USD/JPY feels like a game of cat and mouse to me, where me, as the trader analyzing a move would be the mouse. And the Bank of Japan would be the cat.
While the carry on the pair is still biased on the upside there remains motive for bulls. And if there’s the thought that the BoJ may not be nearing any changes then that rollover can remain as attractive. But if there’s the treat to principal, well that rollover may not be as attractive any longer, and this helps to explain why bearish moves in the pair have been so incredibly violent over the past couple of years. Because when the pair does reverse the carry isn’t as attractive, and that support breach can quickly lead to an exodus of longs that rivals even the lines coming out of Burning Man right now.
What this means is that chasing a trend of this nature can be especially problematic. Instead, the more attractive time to investigate the bullish trend might just be when we’re nearing a point of maximum pessimism? I had been talking about the 145 level for support and that came in again to hold the lows on Friday, which has led to another extension in the bullish move along with a fresh 10 month high, which entailed another resistance breach along the way.
At this point I have price holding resistance at 147.69 which was a swing from last year, and there’s support potential at prior resistance around 146.65. If that can’t hold, 145 is the next spot of support and after that I have another at 143.89 and then another at 142.50.
While grabbing that piece of cheese that appears to be a little higher on the chart, the fear is that the cat comes out to chase the mouse that’s chasing the cheese, and that would be the Bank of Japan responding to prints of fresh highs as the pair gets closer and closer to that 150 level that brought upon intervention last year.
USD/JPY Daily Price Chart
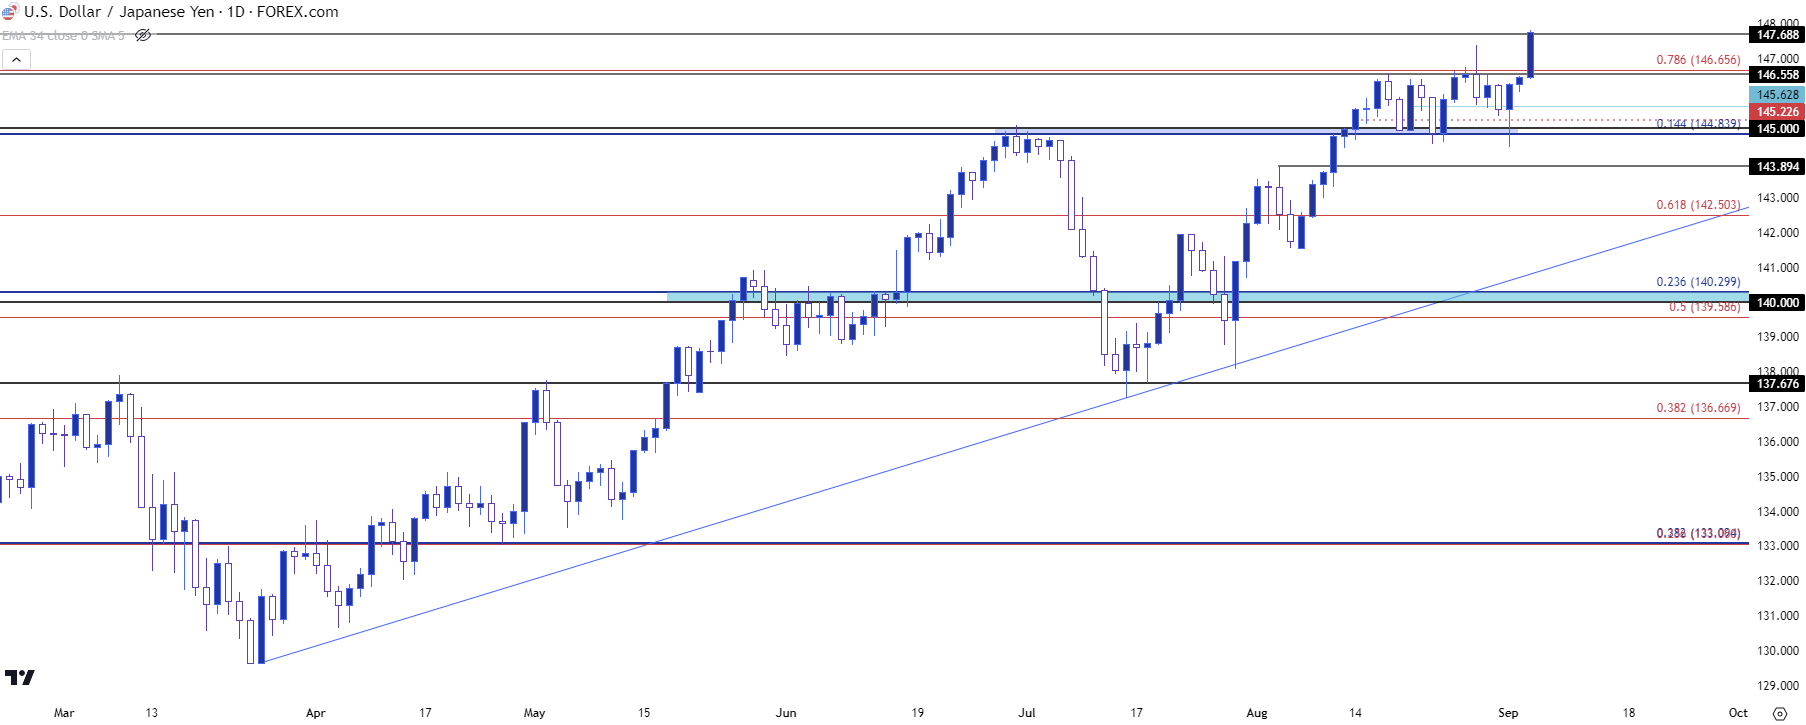
Chart prepared by James Stanley, USD/JPY on Tradingview
Gold: Breakout to Confluent Resistance Brings Pullback
Gold held its own well last week even as USD-strength was coming back online in the back-half of the week. Gold had previously worked through its own bullish theme where the pair had built into a tight consolidation channel in early-August trade which took on the form of a falling wedge. That’s reflected in light red on the below chart, and I was tracking this move in the webinar a couple of weeks ago as price was beginning to venture out of the formation.
That led to bullish continuation and that theme held through the early part of last week, eventually finding resistance at a confluent spot on the chart around the 1947 level. That resistance held the highs on Wednesday, Thursday, and Friday, which is impressive if we consider what the USD was doing at the time.
But bulls have finally started to throw in the towel as this morning has brought pullback in gold, with prices now testing support at prior resistance taken from the same 1925-1932 zone that I was discussing last week.
This keeps the door open for bulls and there’s now a longer-term falling wedge in-play here. If bulls can solve this with topside resolution, there could be considerable potential thereafter. But, for that to come to fruition it seems we would need to see either a paring back in yields or something of that ilk. But, for now we have the support test and a bit deeper is another spot of support potential around the 1910 level.
Gold (XAU/USD) Daily Price Chart
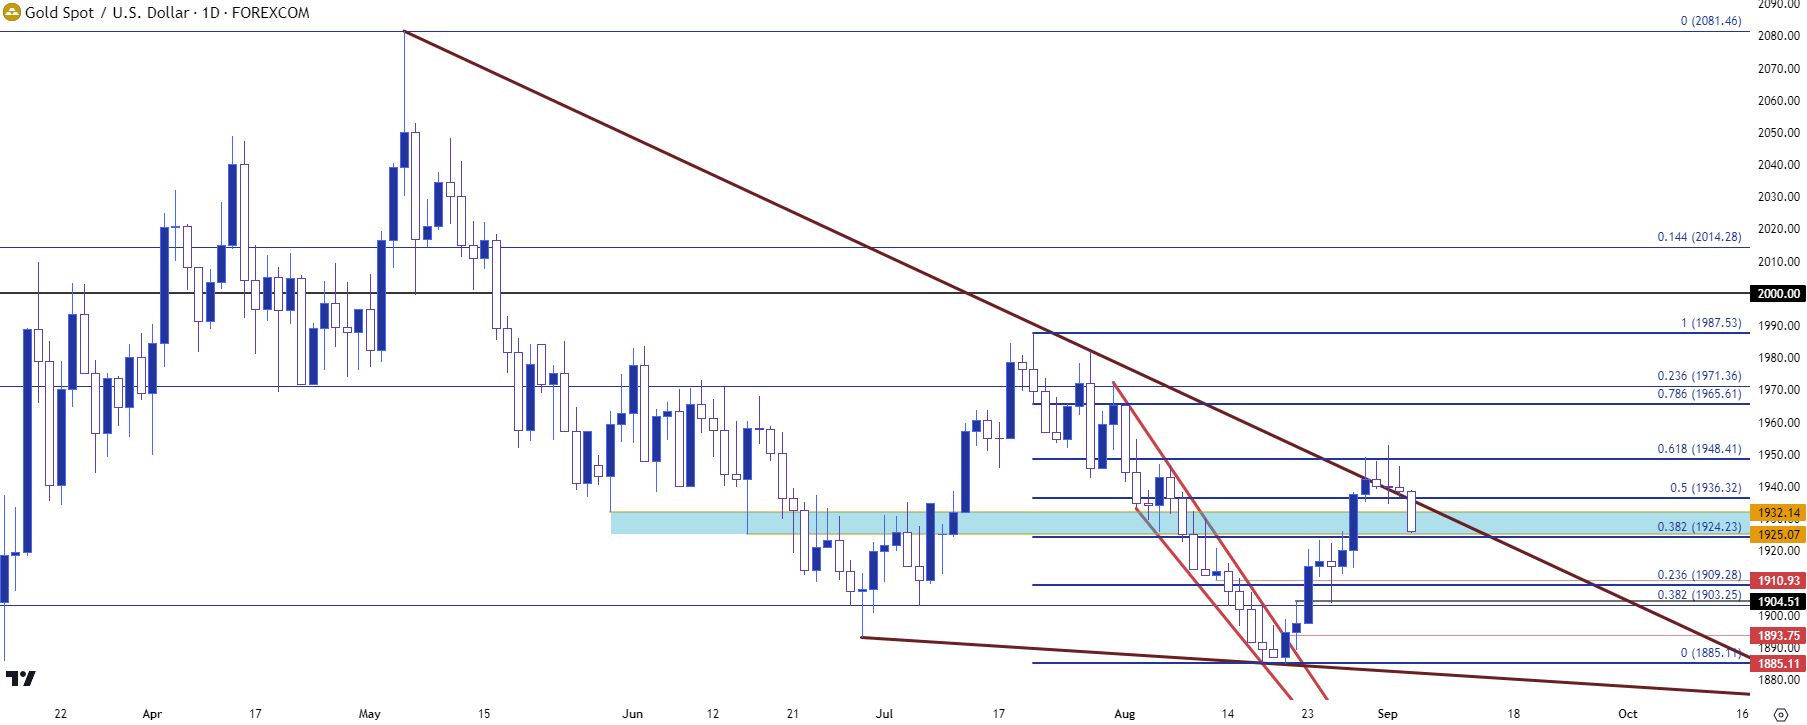
Chart prepared by James Stanley, Gold on Tradingview
S&P 500
The S&P 500 has remained resilient throughout this recent run of USD-strength, which helps to explain at least some of the driver behind the DXY bullish trend. The way that bulls have held higher-lows in the S&P 500 even as that USD-strength move dominated the FX space last week highlights continued optimism in equities and there’s a spot of support potential as taken from prior resistance a little lower, around the 4485-4493 zone.
There’s a resistance level sitting a bit higher on the chart that remains of interest, as this was a cliff of support that held the lows this summer before bears came out in August, and this runs around the 4560 level. And above that there’s a bit of unfilled gap from early-August trade that runs up to 4600.
Since bulls appear willing to hold support, the big question is whether there’s enough of them left on the sidelines to jump in at tests of 4560 or 4600 to continue driving the breakout. Or, whether that ends up as a capitulation high type of scenario.
S&P 500 Daily Price Chart (indicative only, not available on Forex.com platforms)
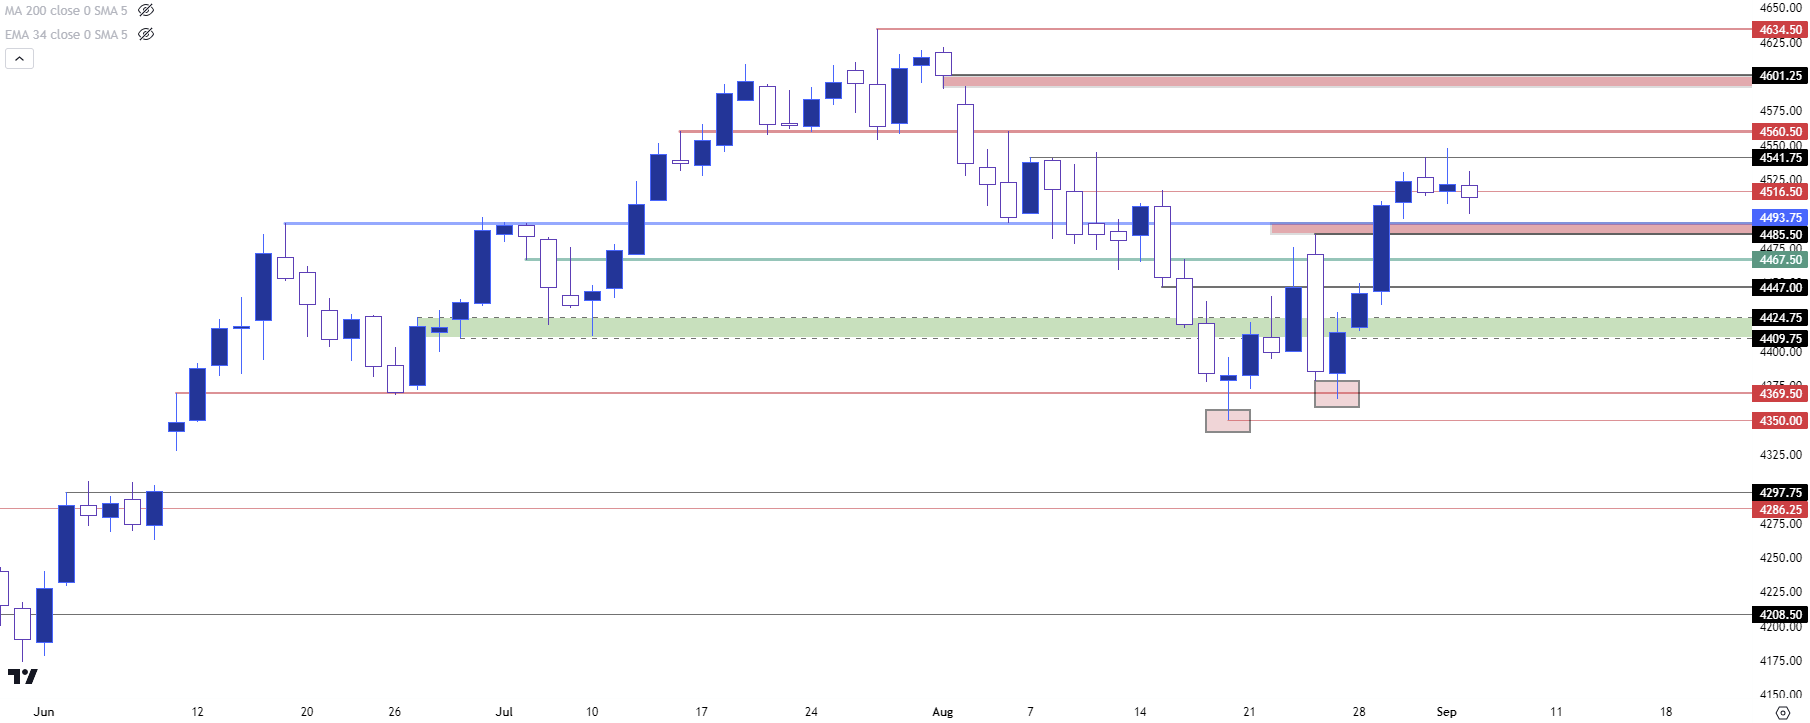
Chart prepared by James Stanley; data derived from Tradingview
--- written by James Stanley, Senior Strategist


