US Dollar Outlook: USD/JPY
USD/JPY appears to be stuck in a defined range even as US JOLTS Job Openings climbs to 8.04M in August from 7.71M the month prior, but the ongoing shift in the carry trade may continue to influence the exchange rate as the Federal Reserve plans to further unwind its restrictive policy.
USD/JPY Outlook Mired by Negative Slope in 50-Day SMA
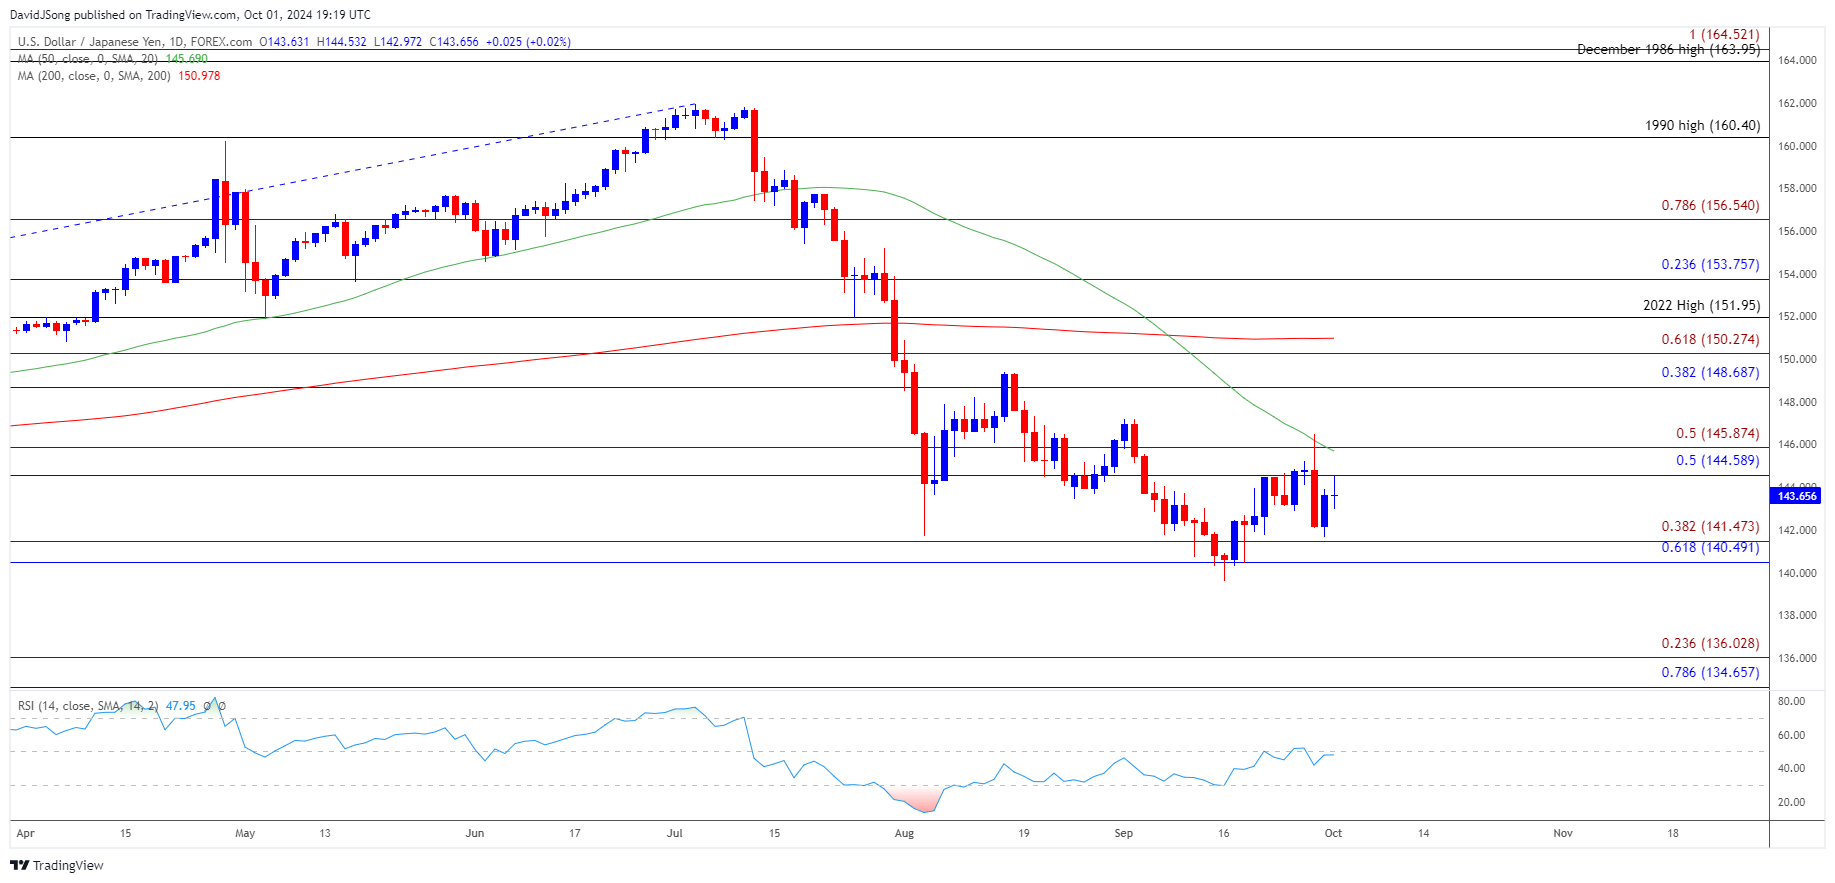
USD/JPY holds below the 50-Day SMA (145.69) following the failed attempt to test the September high (147.21), and it remains to be seen if the exchange rate will track the negative slope in the moving average as Fed Chairman Jerome Powell acknowledges that ‘if the economy evolves broadly as expected, policy will move over time toward a more neutral stance.’
Join David Song for the Weekly Fundamental Market Outlook webinar. David provides a market overview and takes questions in real-time. Register Here
Nevertheless, Chairman Powell insists that ‘we are not on any preset course’ while speaking at the National Association for Business Economics, with the official going onto say that ‘this is not a committee that feels like it’s in a hurry to cut rates quickly.’
With that said, USD/JPY may face range bound conditions as recent remarks from Chairman Powell curb speculation for another 50bp rate cut, but swings in the carry trade may continue to impact the exchange rate as major central banks implement lower interest rates.
USD/JPY Price Chart – Daily

Chart Prepared by David Song, Strategist; USD/JPY on TradingView
- Keep in mind, the recent recovery in USD/JPY emerged following the failed attempts to close below the 140.50 (61.8% Fibonacci retracement) to 141.50 (38.2% Fibonacci extension) zone, and the exchange rate may further retrace the decline from the September high (147.21) as it extends the advance from the start of the week.
- However, lack of momentum to close above the 144.60 (50% Fibonacci retracement) to 145.90 (50% Fibonacci extension) region may keep USD/JPY within the September range, and the exchange rate may track sideways if it largely ignores the negative slope in the 50-Day SMA (145.69).
- Meanwhile, a close below the 140.50 (61.8% Fibonacci retracement) to 141.50 (38.2% Fibonacci extension) zone may push USD/JPY towards the July 2023 low (137.24), with the next region of interest coming in around 134.70 (78.6% Fibonacci retracement) to 136.00 (23.6% Fibonacci extension).
--- Written by David Song, Senior Strategist
Follow on Twitter at @DavidJSong


