US Dollar Outlook: USD/JPY
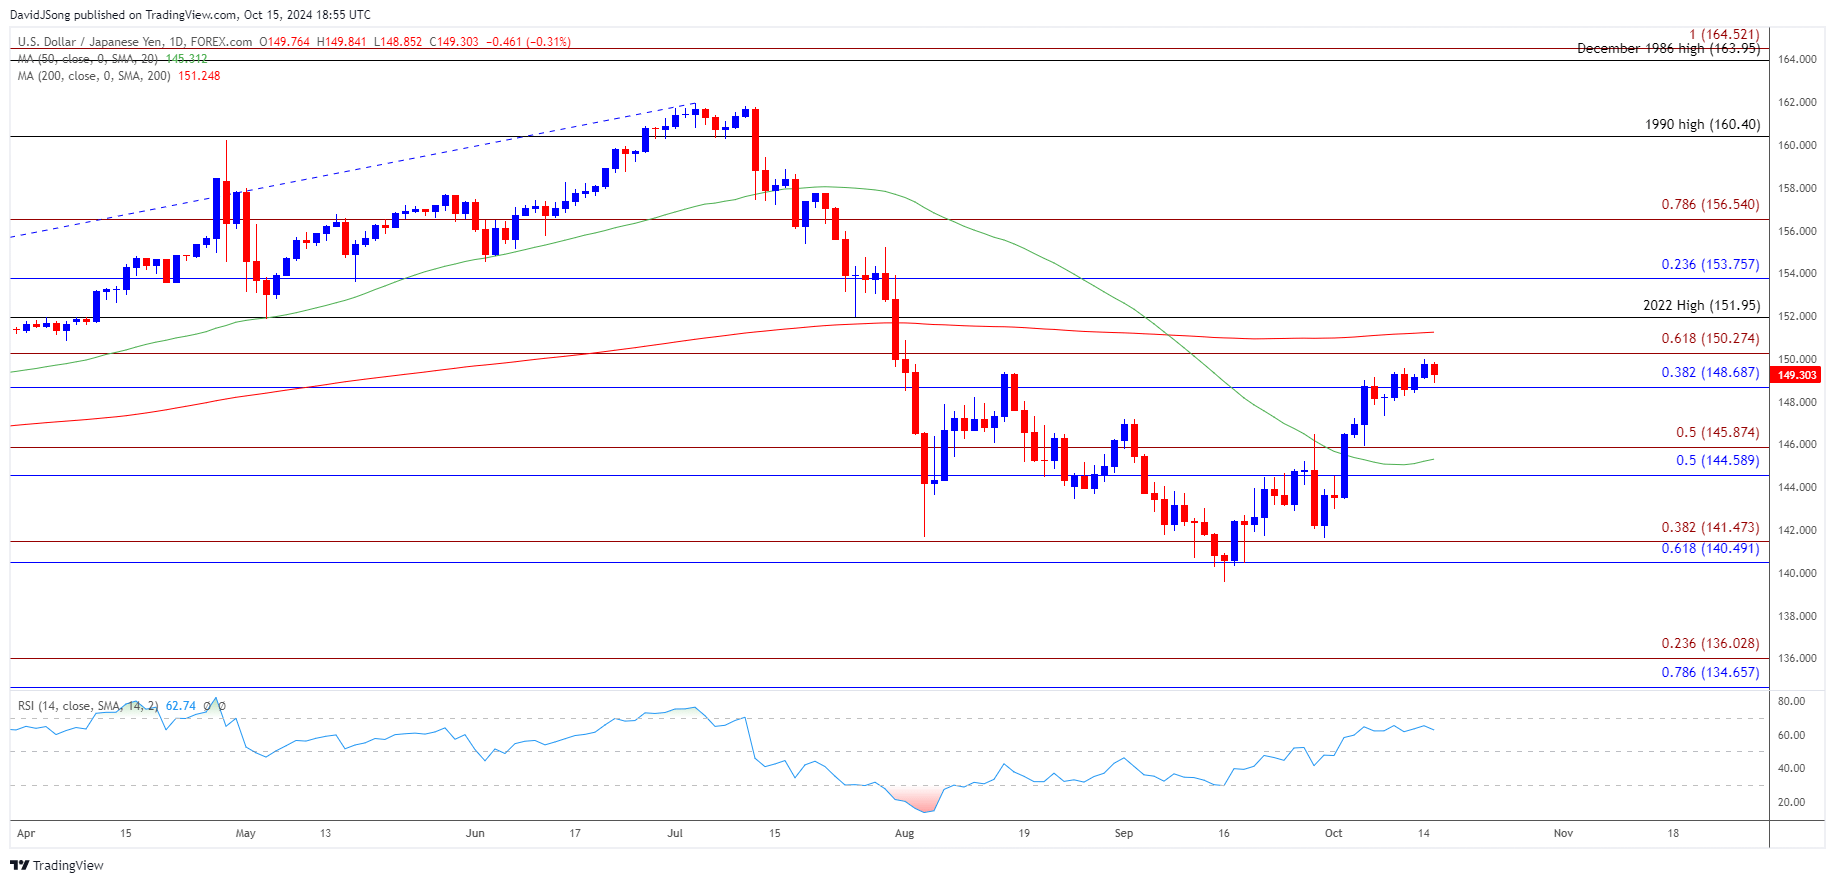
USD/JPY pulls back from a fresh monthly high (149.98) despite signs of a growing dissent within the Federal Reserve, and lack of momentum to test the August high (150.89) may keep the Relative Strength Index (RSI) out of overbought territory.
US Dollar Forecast: USD/JPY Vulnerable on Failure to Test August High
The recent advance in USD/JPY appears to be stalling ahead of the US Retail Sales report as it no longer carves a series of higher highs and lows, and the RSI may show the bullish momentum abating should it continue to hold below 70.
US Economic Calendar

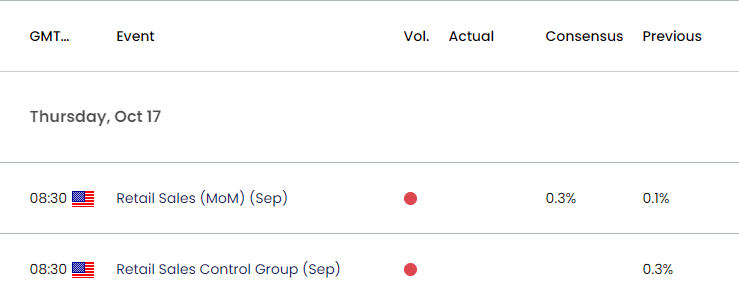
It remains to be seen if the Retail Sales report will influence USD/JPY as household consumption is expected to increase 0.3% in September, but signs of a stronger-than-expected economy may sway the Federal Open Market Committee (FOMC) as Governor Christopher Waller emphasizes that ‘we have seen upward revisions to GDI (Gross Domestic Income), an increase in job vacancies, high GDP growth forecasts, a strong jobs report and a hotter than expected CPI (Consumer Price Index) report.’
Join David Song for the Weekly Fundamental Market Outlook webinar. David provides a market overview and takes questions in real-time. Register Here
In turn, Governor Waller acknowledged that ‘this data is signaling that the economy may not be slowing as much as desired’ while speaking at Stanford University, with the official going onto say that ‘monetary policy should proceed with more caution on the pace of rate cuts than was needed at the September meeting.’
With that said, waning speculation for another 50bp rate cut may keep USD/JPY afloat ahead of the next Fed rate decision on November 7, but the exchange rate may struggle to retain the advance from earlier this month should it fail to test the August high (150.89).
USD/JPY Price Chart – Daily

Chart Prepared by David Song, Strategist; USD/JPY on TradingView
- USD/JPY may struggle to retain the advance from earlier this month if it fails to break/close above the 148.70 (38.2% Fibonacci retracement) to 150.30 (61.8% Fibonacci extension) region, with a move below the 144.60 (50% Fibonacci retracement) to 145.90 (50% Fibonacci extension) zone bringing the monthly low (142.97) on the radar.
- Next area of interest comes in around 140.50 (61.8% Fibonacci retracement) to 141.50 (38.2% Fibonacci extension) but a break/close above the 148.70 (38.2% Fibonacci retracement) to 150.30 (61.8% Fibonacci extension) region may push USD/JPY towards the August high (150.89).
- A move back above the 2022 high (151.95) opens up 153.80 (23.6% Fibonacci retracement), with the next area of interest coming in around 156.50 (78.6% Fibonacci extension).
Additional Market Outlooks
USD/CAD Rally Eyes August High as RSI Pushes into Overbought Zone
British Pound Forecast: GBP/USD Susceptible to Test of September Low
EUR/USD Outlook Hinges on ECB Interest Rate Decision
Gold Price Forecast: Bullion Breaks Out of Bull Flag Formation
--- Written by David Song, Senior Strategist
Follow on Twitter at @DavidJSong


