Canadian Dollar Talking Points:
- USD/CAD has continued to rally with price pushing up to a fresh two-month-high today.
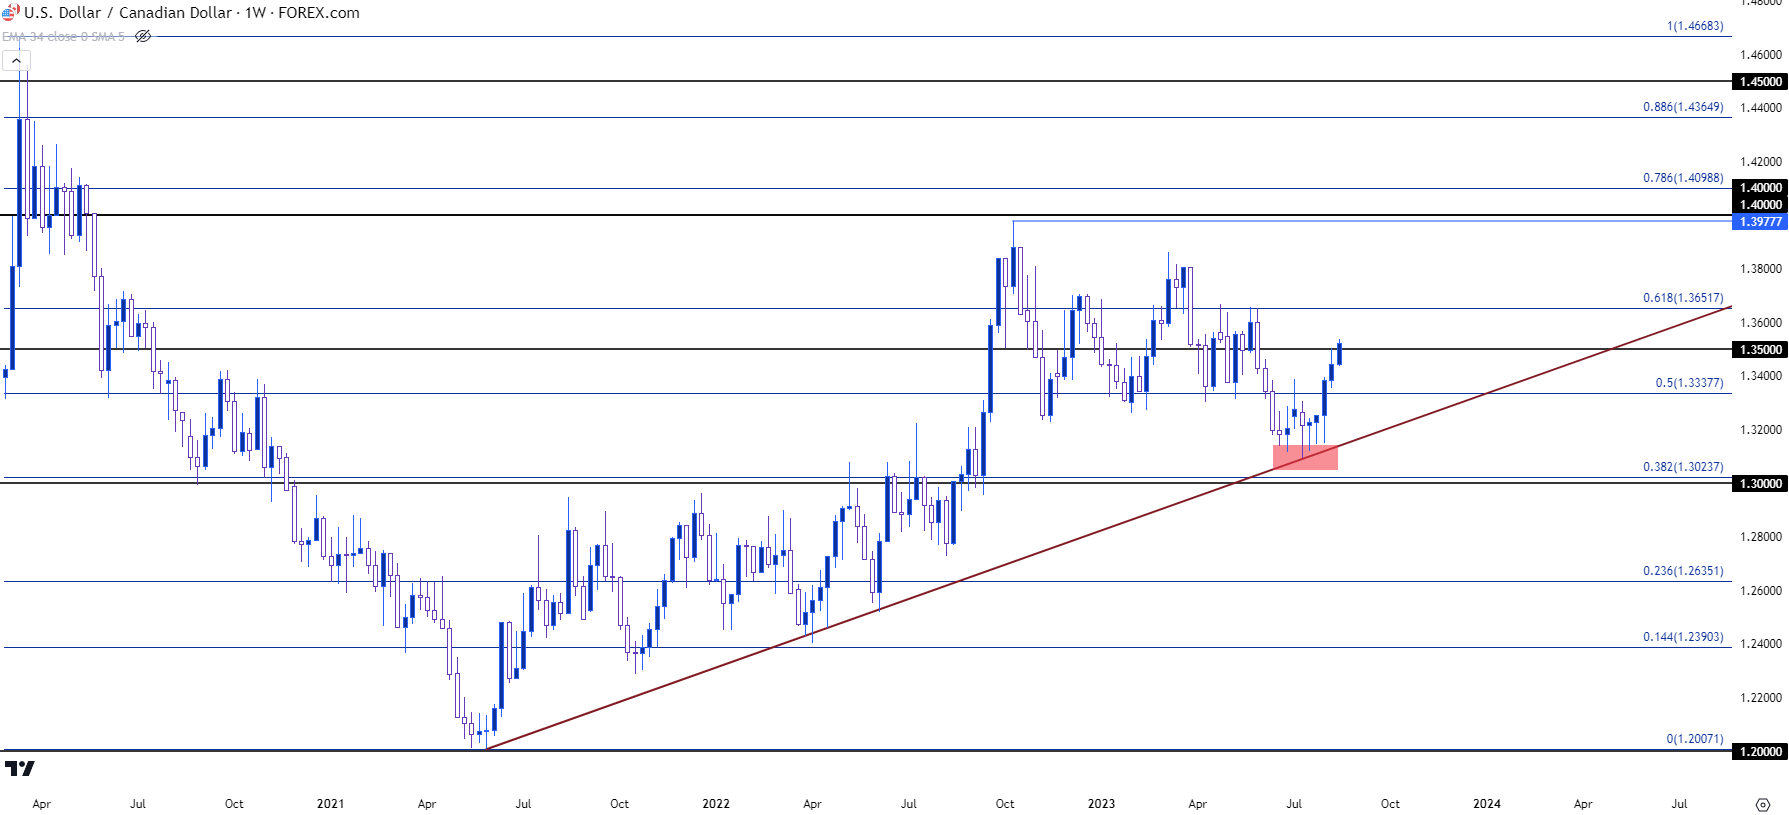
- Bulls have taken charge of the pair in August trade and this comes after the June sell-off stalled throughout July, eventually finding support at a long-term trendline while building a falling wedge formation.
- I’ll be discussing these themes in-depth in the weekly webinar on Tuesday at 1PM ET. It’s free for all to register: Click here to register.
The US Dollar has thus far held its breakout out of the falling wedge formation and there are few major pairs where that bullish theme has shown as clearly as USD/CAD.
The US Dollar set its current yearly low last month just a few days after the release of CPI data. In the US Dollar (via DXY) that created a short-term double bottom formation that soon led to a breakout, but in USD/CAD, the support inflection on Friday July 14th showed at a key spot on the chart, as taken from a trendline projection connecting May 2021 and June 2022 swing lows.
That support inflection is noted with a red box on the below weekly chart, but also notice the number and frequency of underside wicks as that support test was taking place. This was clear evidence of bulls coming in to buffer the sell-off even though they were unable to take control of price action at the time. We’ll get to that in a minute…
USD/CAD Weekly Price Chart

Chart prepared by James Stanley, USD/CAD on Tradingview
USD/CAD Daily Chart
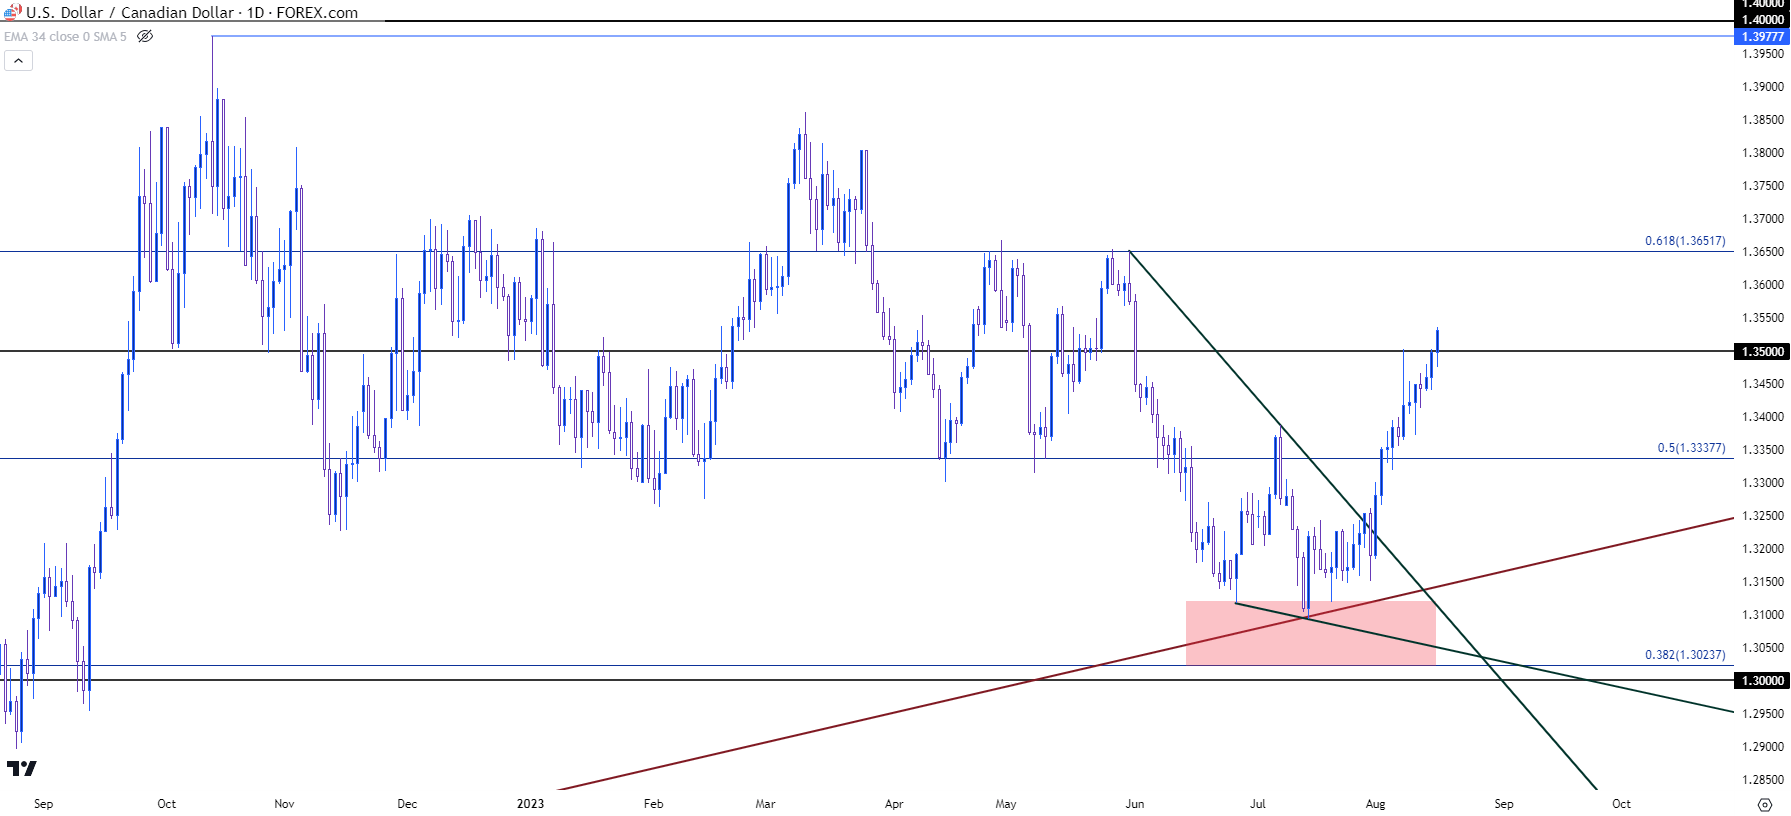
The lead-in to that support test is relevant, as it was a surprise rate hike from the Bank of Canada in the month of June that broke the range that had held for a few months prior. That injection of CAD-strength as the Fed was expected to skip a rate hike in June allowed for a downside break in USD/CAD and price continued to push lower until that trendline came into play. And once it did, sellers were stalled even further as there was the shorter-term development of higher lows.
As that support test was taking place, price built a falling wedge formation, often approached with the aim of bullish reversals, and that’s what’s led into the August pattern of strength so far in the pair. Price action is continuing to run the breakout from that formation, as I’ve looked at in the webinars over the past couple of weeks.
So far in August, USD/CAD has posted a green daily bar for ten of twelve trading days, illustrating the strength in the pair as price broke out of that consolidation formation at the start of the month.
USD/CAD Daily Chart

Chart prepared by James Stanley, USD/CAD on Tradingview
USD/CAD: Bullish Breakout into Bullish Trend
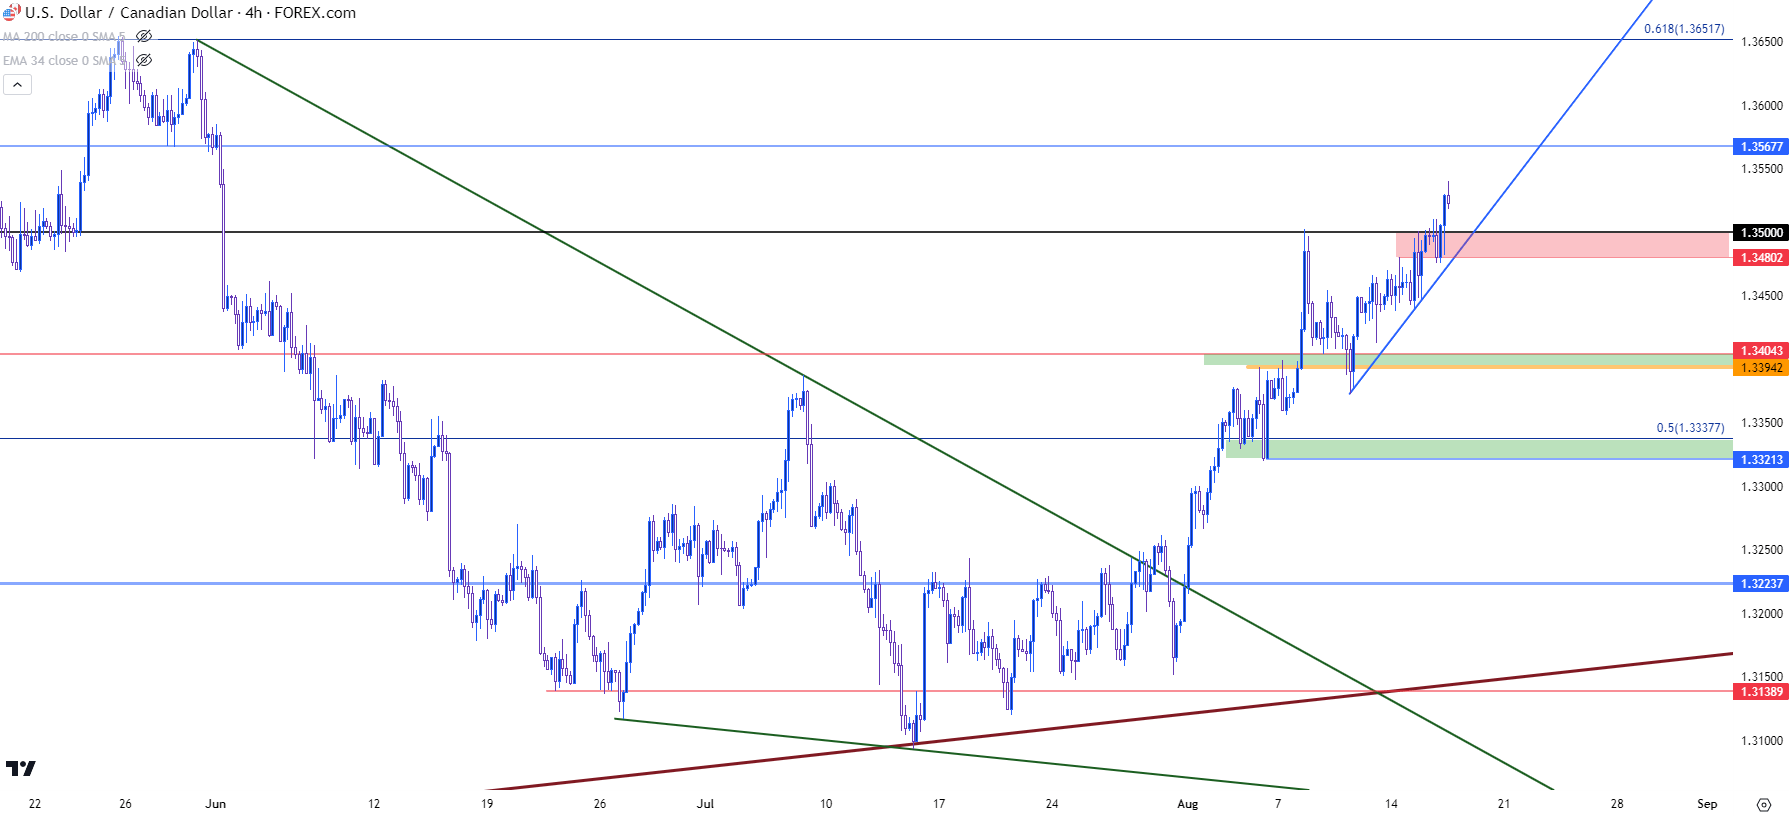
USD/CAD began to re-test resistance at the 1.3500 handle last week, just ahead of the webinar on that day. And while the bullish breakout was quite clear, the fear at that point was chasing an overbought move. So, instead, I focused in on support potential and the prior zone of resistance, around the 1.3400 handle, seemed a comfortable nearby area to monitor for such.
That support showed over the next couple of days and since then bulls have been taking an increasingly stronger touch with the matter, as illustrated by the bullish trendline on the below chart (in blue). And as I remarked on in yesterday’s webinar, USD/CAD could remain attractive for scenarios of USD-strength as the additional weakness introduced by the Canadian Dollar has so far made for a stronger trend than what’s shown in DXY, alone.
From the four-hour chart, the concern at this point would be chasing a fresh breakout that’s testing above a massive level of prior resistance. The 1.3500 level had even stalled the breakout before bulls made today’s push, and this does set up some interest for bullish continuation scenarios as that prior spot of resistance can now function as higher-low support potential. I’ve noted that zone below in red, extending from prior resistance-turned-support at 1.3480 up to the 1.3500 handle.
On the resistance side of the matter, the big level looming overhead is the Fibonacci level at 1.3652 and this was a price that was in-play quite a bit in the first half of the year. Most recently, that was the swing-high just before the sell-off took over in June, so bulls mounting above that would bring on a fresh four-month high into the picture.
USD/CAD Four-Hour Price Chart

Chart prepared by James Stanley, USD/CAD on Tradingview
--- written by James Stanley, Senior Strategist


