- The inverse relationship between gold with the US dollar and bond yields has returned
- Events that can shift the US rates outlook likely to be influential on the gold price this week
- The unwind of Fed rate cut bets creates asymmetric dovish risks for data release
- US core PCE inflation and Eurozone inflation headline event risk
- Gold is down but the bullish trend is not out
Gold’s unusually strong correlation with the US dollar and US Treasury yields has reversed, with bullion beaten up last week as Fed rate cut bets were unwound. Should the inverse correlation persist, it means the near-term gold outlook may be driven by new information that shifts the prevailing rates narrative.
On that front, you can’t look past the Fed’s preferred underlying inflation indicator, the core PCE deflator, which arrives on Friday. For gold traders, the best is left until last this week.
Yields, dollar back in the driving seat
To provide context to the remarks above, the chart below looks at gold’s rolling daily correlation with the US dollar, US 10-year Treasury yields and US real, inflation-adjusted 10-year Treasury yields over the past 20 trading sessions. Essentially, the relationship between the variables over the past month.

Usually, as an asset widely quoted in US dollars and with no yield, gold typically struggles when the US dollar and bond yields are higher, especially when the latter is higher than inflation. But for much of last month, gold had a positive and strong correlation with the three variables, a scenario that is rare when you look back over history. Some speculated it may have been central bank purchases, or linked to geopolitical tensions in the Middle East, or simply the bullish technical breakout drawing buyers from the sidelines.
However, that changed in May. Rather than being positively correlated, gold is now often moving in the opposite direction to the dollar and yields, reverting to the relationship that is often seen. While not the strongest inverse relationship you’ll see, it’s been noticeable over the past month.
Risks are asymmetric for the Fed rate path
Even though drivers can change over time, right now, the relationship suggests Fed rate expectations are proving to be particularly influential on gold. With that in mind, it suggests traders need to pay attention to data and events that could shift the US rates outlook meaningfully next week.
Looking at the calendar, Friday looms large with not only the US core PCE deflator but also the flash eurozone inflation report for April. In terms of what could meaningfully deviate US rates expectations, and the US dollar, those are it.
Ahead of those updates, events that could spark volatility include two, five and seven-year Treasury note auctions on Tuesday and Wednesday, along with speeches from key Fed officials Loretta Mester (Tues), John Williams (Wed, Thurs) and Lorie Logan (Thurs). However, like last week, with no new major economic data to guide them until after they have spoken, it’s difficult to see them deviating too far from the higher for longer rates messaging that’s been around for months.
On the data calendar, second-tier releases dominate, although Wednesday’s updated Q1 US GDP print and consumer confidence read on Tuesday may be influential if they deviate significantly from their prior readings.
The key thing to remember when applying your macro filter is that with markets scaling back Fed rate cut bets this year from nearly seven to just one, it’s now up to incoming information to justify the big dovish rates unwind. Therefore, risks are asymmetric, with information casting doubt on the higher for longer rates outlook likely to deliver a far larger market reaction than that which maintains the status quo.
Gold technical outlook
With the macro events calendar checked off, it’s time to overlay that information on the technical picture for gold.
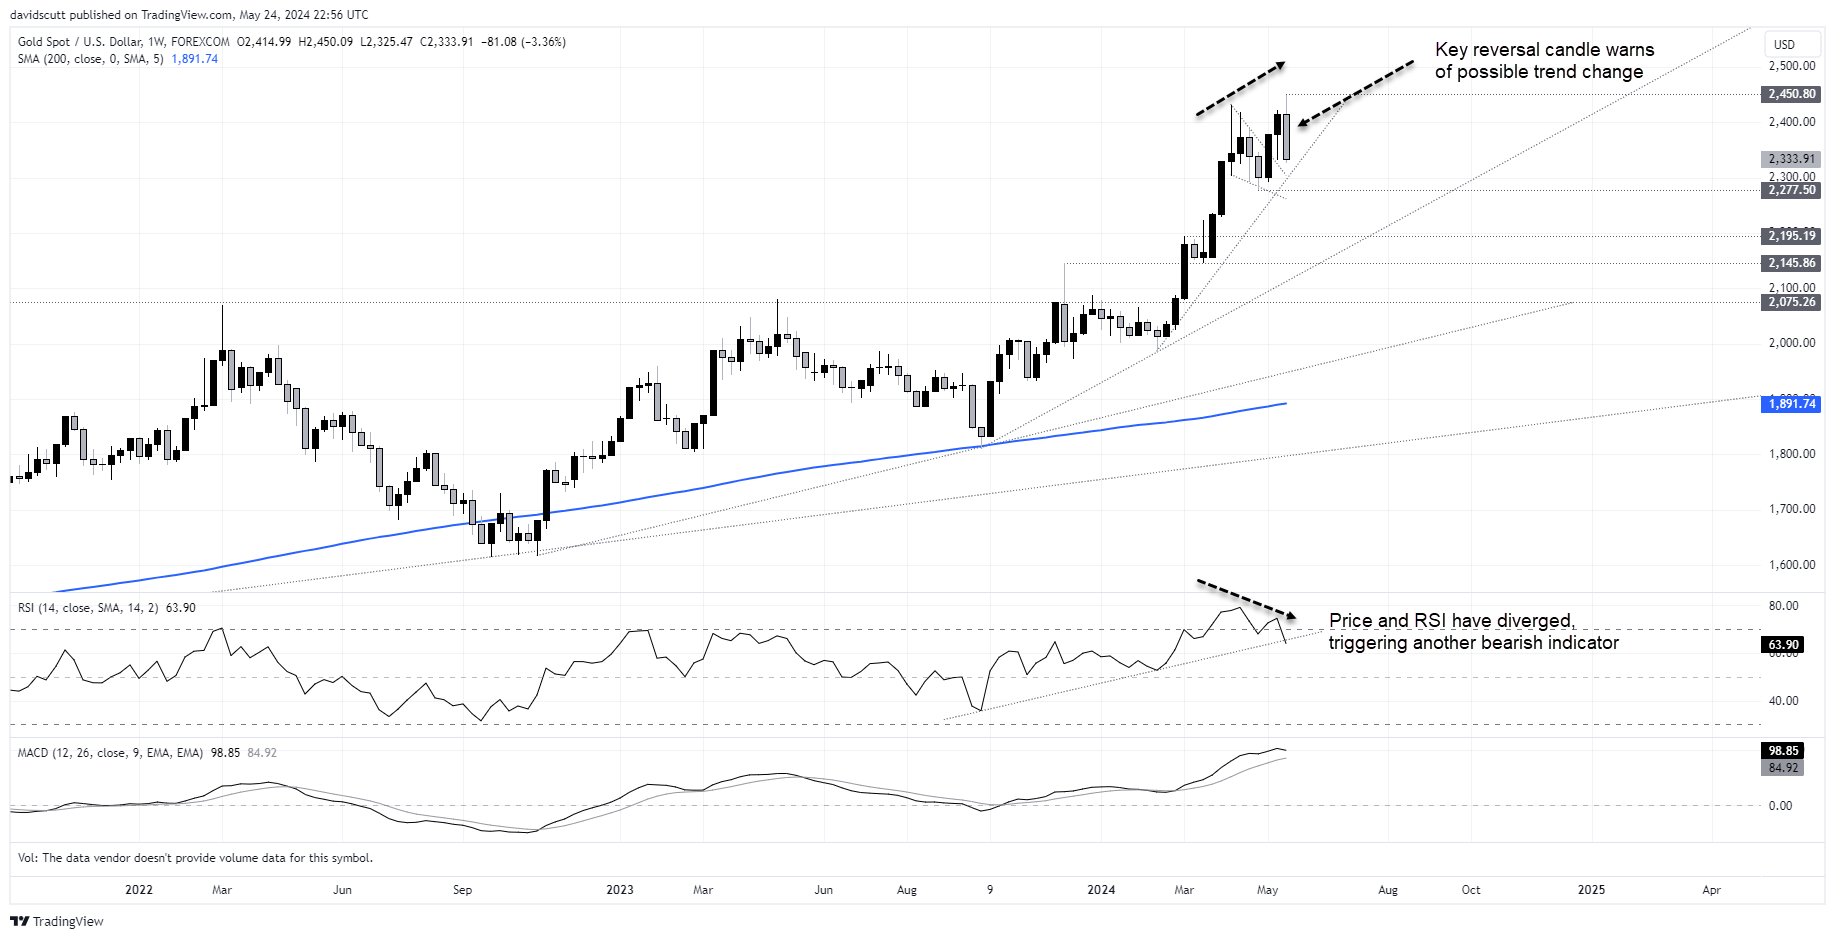
Zooming out to a weekly timeframe, the price action warns of a potential trend change. Not only did gold print a key reversal candle last week but we’ve also seen divergence between momentum and price, with the former printing lower highs as the latter hit record highs. With the uptrend in RSI threatening to break down, the weekly chart warns of downside ahead.
But just how much downside is questionable. As discussed above, from a fundamental perspective, risks for the US dollar and yields are skewed to the downside after the significant curtailment of rate cut bets from the Fed. It’s now up to the data to continuing to justify rates being left on hold, otherwise we could easily see a leg lower in the US dollar and yields.
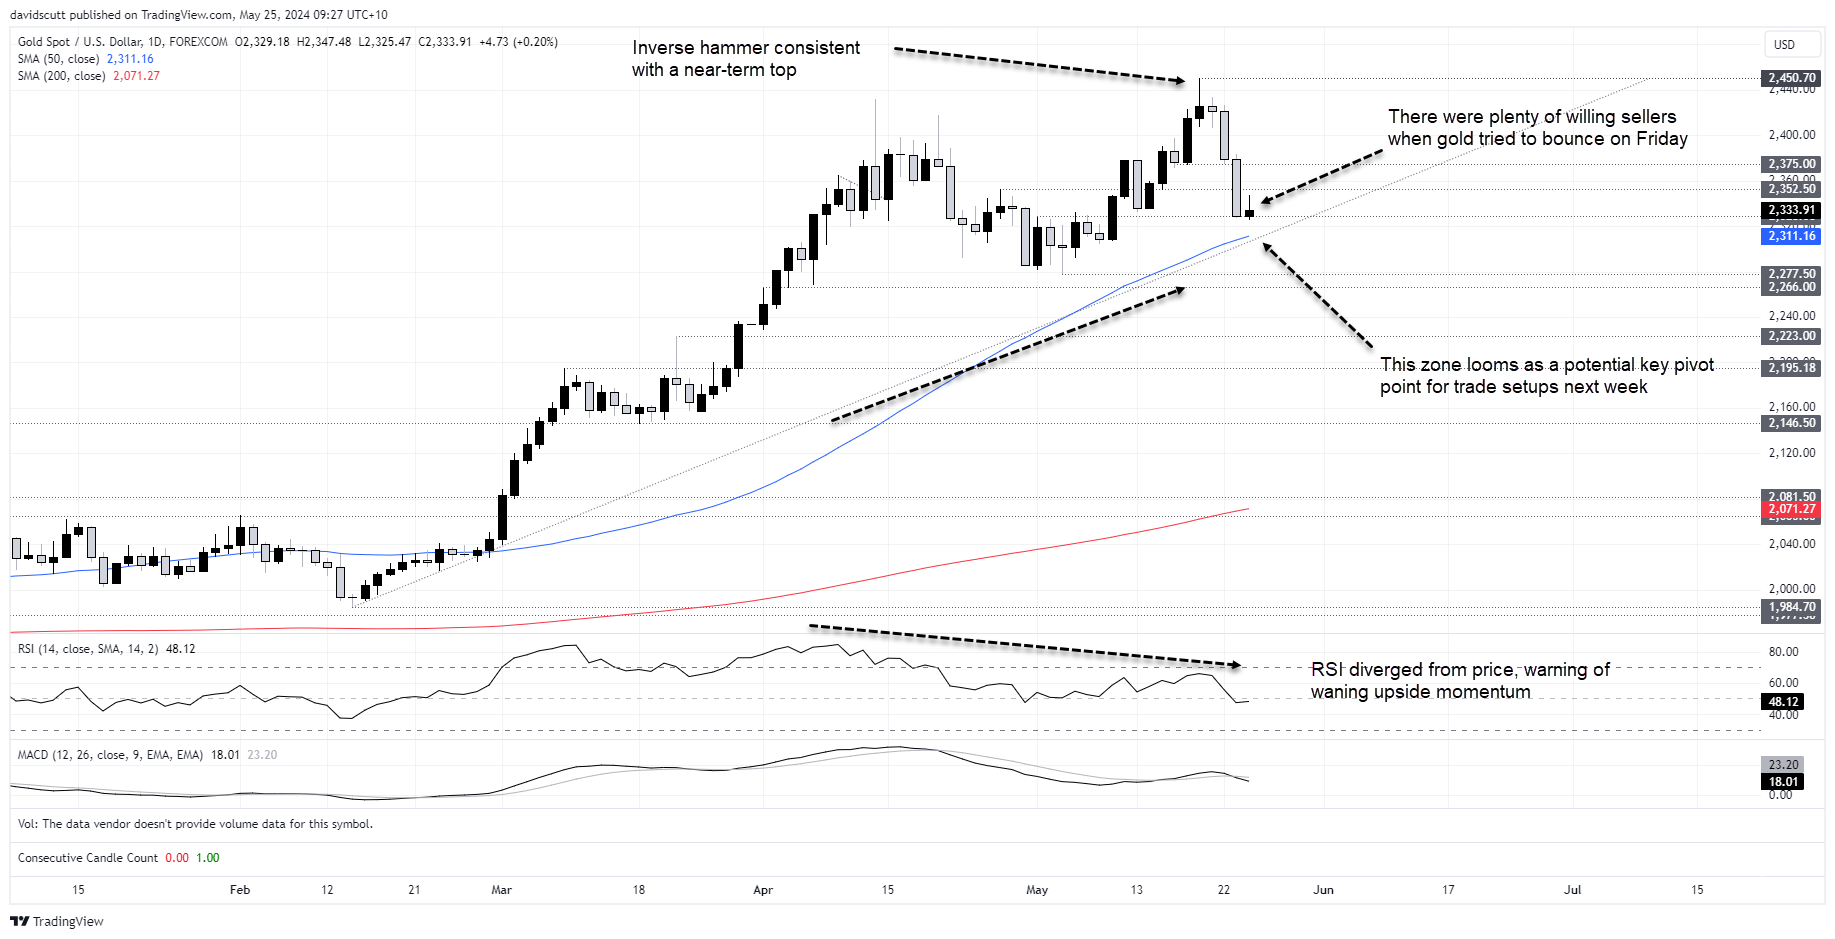
And when you zoom in on gold to a daily timeframe, the path to further weakness becomes more complicated. Yes, the inverse hammer candle on Friday fits with continued downside risk, as does the divergence between RSI and price, but with the 50-day moving average and uptrend dating back to February located around $2310, that zone looms as a major test for bears next week.
Should that zone give way, $2277.50 and $2266 are the initial downside targets for shorts, allowing for traders to sell the break with a stop above the former uptrend for protection. In the unlikely scenario of a deeper downside flush next week, $2223 and $2195 would become the next targets on the radar.
Alternatively, should gold manage to hold above the trendline and 50DMA, traders could buy the dip with a stop below these levels for protection. $2328.50
-- Written by David Scutt
Follow David on Twitter @scutty


