Yesterday, the NAHB released its Housing Market Index for August at 75 vs 80 in July and 79 expected. The number has slowly been trending lower since a high of 90 in November 2020 and is at the lowest levels since July 2020. Today, the US released Housing Starts for July. The print was -7% vs -2.6% expected. In addition, June’s print was revised lower from +6.3% to +3.5%. Therefore, with June’s housing starts revised lower, a lower than expected July reading, and a lower than expected August NAHB Housing Market index, it’s easy to see that builders are slowing their pace. One may have expected this in the spring with rising lumber prices, however lumber is down over 70% from its May 10th high. Is it possible that builders are concerned about future rising interest rates, which may slow demand? On the bright side, building permits increased from -5.3% to 2.6%, however this increase is from a 1 year low. They key will be to see if this can be sustained.
In the meantime, we need to wait for July’s Existing Home Sales and New Home Sales reports due out on Monday and Tuesday, respectively. June’s Existing Home Sales print was 1.4% and the New Home Sales print was -6.6%. Traders will be watching to see if home buyers are as unenthusiastic about buying new homes as builders think they will be. Note though, that housing data is coming off very high levels, so even if the data is shows house buying is slowing down, it may just be normalizing and not a sign of a collapse.
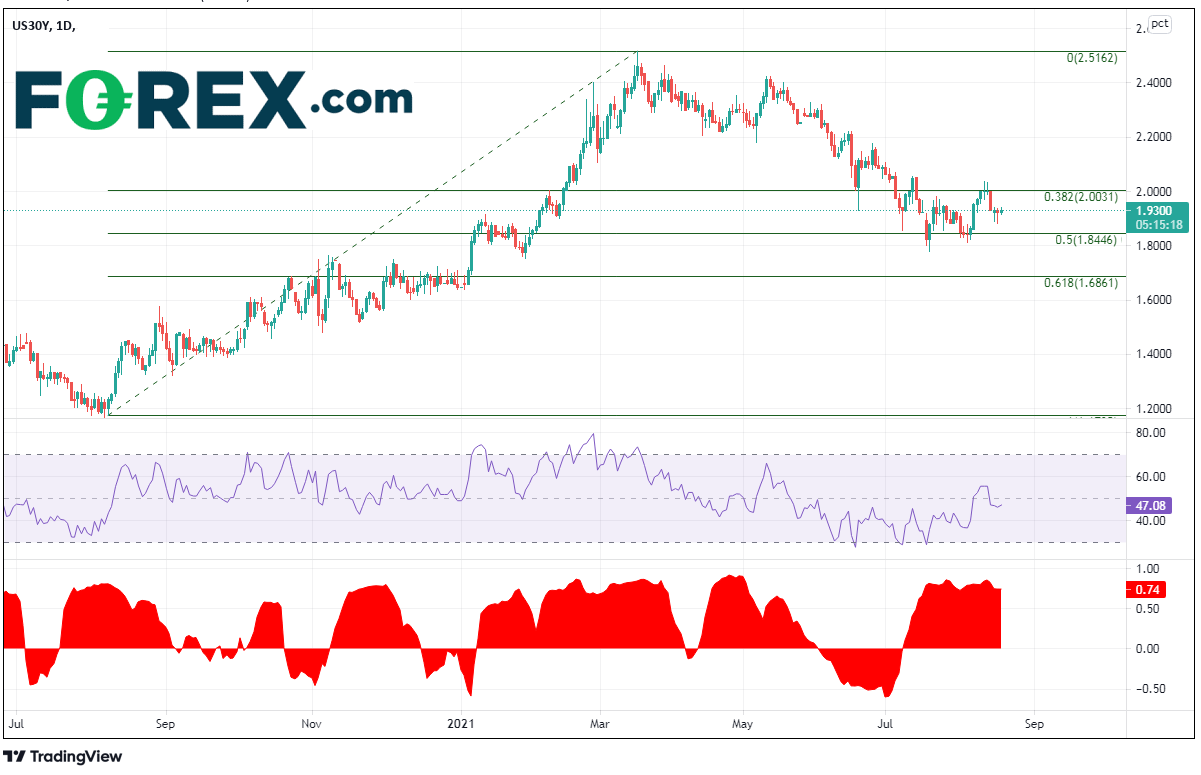
30 Year Bond yields have pulled back from their March 18th highs of 2.5162 to a low of 1.7800 on July 20th. However, long-term yields have managed to hold support at the 50% retracement level from the August 7th, 2020 lows to the March 18th highs, near 1.8446. Since the July 20th low, 30-year yields have been oscillating in a range between 1.8110 and 1.9720 as bond traders wait for their next signal from the Fed. Notice the correlation coefficient between 30 Year Bond yields and USD/JPY, which is currently +0.74 on a daily timeframe. The correlation between the 2 assets had been rising since early June from negative territory and leveled off in late July, reaching as high as +0.85. As we have discussed before, recent moves in bond yields can help USD/JPY traders in determining direction. If yields move higher, USD/JPY has been moving higher as well. If yields move lower, USD/JPY has been moving lower with them.

Source: Tradingview, Stone X
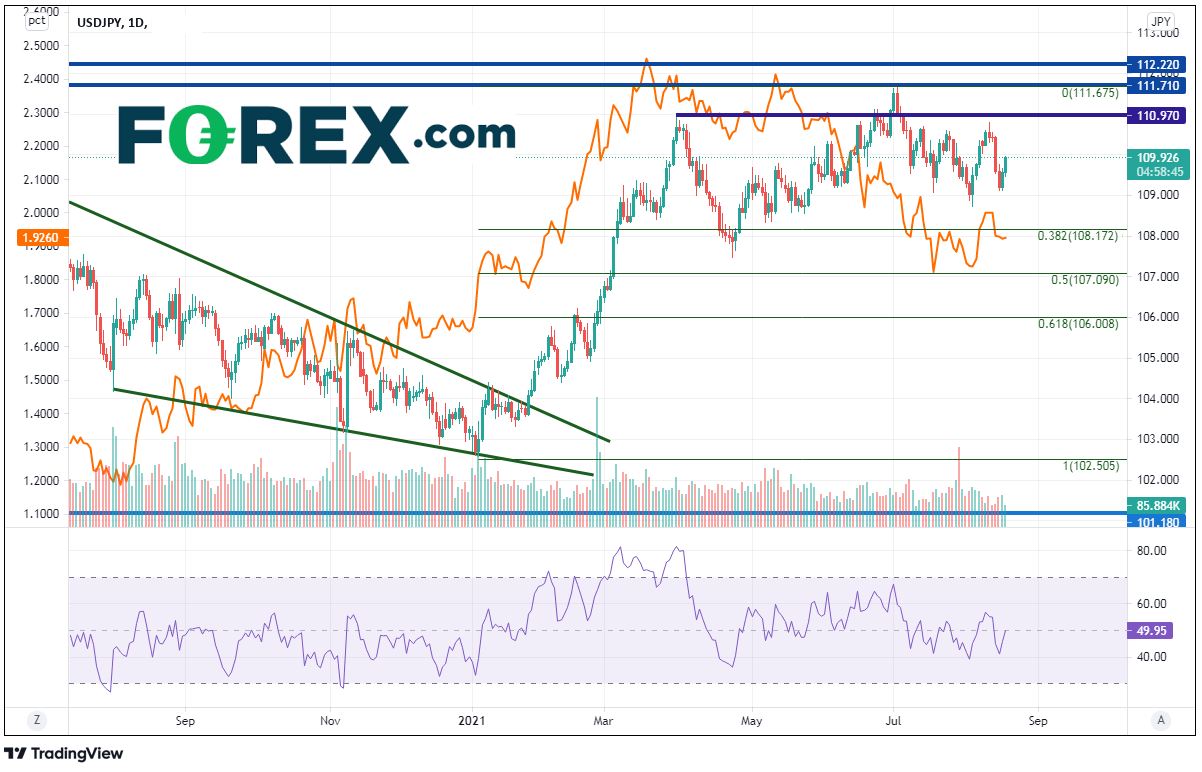
Below is a chart of USD/JPY overlaid with 30 Year Bond yields. Notice how since the beginning of 2021, USD/JPY and yields traded together. Yields peaked and moved lower on March 18th, while USD/JPY peaked March 31st. However, the 2 assets diverged from mid-May until late June as yields moved lower and USD/JPY higher. USD/JPY eventually peaked in early July and began moving lower once again with yields.

Source: Tradingview, Stone X
As USD/JPY and 30-Year Bond yields are currently trading together on the daily timeframe. A move higher in yields may provide a signal not only for the housing market (higher yields may mean lower demand for houses), but also provide the next move in USD/JPY. The Jackson Hole Symposium may be the catalyst bond traders are waiting for to determine their next move.


