US Dollar Talking Points:
- The US Dollar spent the first half of the year consolidating into a falling wedge formation. Bears went for the breakdown move in July but failed and price has snapped back, taking out resistance along the way while opening the door for bulls.
- The US Dollar is holding resistance at a trendline after breaking out of a falling wedge formation. USD/CAD and USD/JPY have been amenable markets for USD-bulls, while GBP/USD may retain some attraction for USD bears or for those looking to fade this recent run of US Dollar strength.
- This week’s key driver is the Jackson Hole Economic Symposium starting on Thursday and running into the end of the week, and that’s followed by a big week of data with US Consumer Confidence, PCE and Non-farm Payrolls for the month of August.
When a forceful trend appears in the FX market there are wide ranging connotations that can be seen in many other markets. The bullish trend in the US Dollar in 2021 and 2022, driven by the Fed’s efforts to stem inflation, continues to carry impact today.
While the move in the DXY set its current top last September with a forceful pullback, helped along by the European Central Bank’s rate hikes bringing life back into the single currency, there’s been far less trend to work with so far in 2023 as the currency has spent the bulk of the year in consolidation. But that may be on the cusp of change as we saw a false breakdown last month run into a bullish breakout this month.
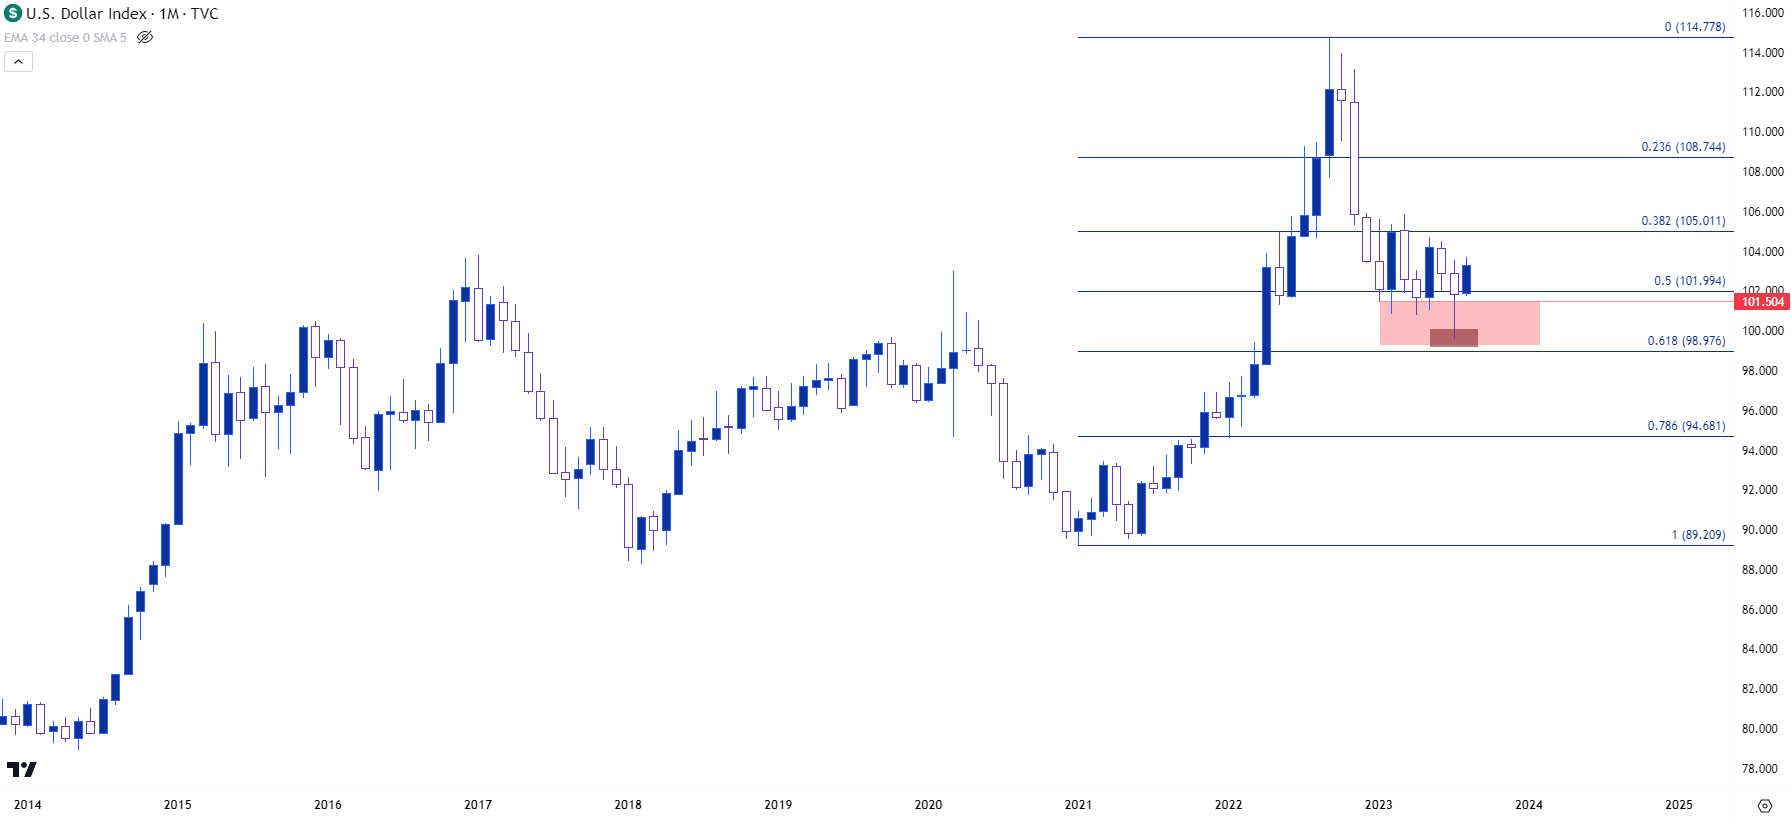
Consolidation began to show signs of giving way in July when bears pounced following a CPI print. The data printed below expectations, and this was another excuse for USD bears to push price down to a lower-low. The only problem was that the move exhausted shortly after, and sellers did not return to hold resistance at a lower-high. We can see this on the below monthly chart with the elongated wick from the month of July, highlighting a false breakout that’s since been followed by a return of USD bullish strength, very similar to what showed for much of last year.
US Dollar - DXY Monthly Price Chart (indicative only, not available on Forex.com platforms)

Chart prepared by James Stanley; data derived from Tradingview
US Dollar Intermediate-Term
Going down to the weekly chart can further highlight just how aggressive bulls have been after that failed bearish breakout. The USD has now gained for five consecutive weeks after that breakdown move in mid-July, and this further illustrates the failure from sellers to push when the door was wide open to run the USD down to a fresh low.
As to why this happened, there’s a few culprits and one can be dialed back to the Euro. The Euro makes up a whopping 57.6% of the DXY quote, and mid-July is around the time that worries began to show around the single currency as European data had started to show less strength. While we’re still waiting to witness lag effects in a strong US economy, weakness in data has already begun to show in Europe and along with it is the fear that the ECB may have little room to continue tightening.
From the weekly chart of DXY below, we can see a falling wedge formation that built and confirmed after the breakdown move in July. Falling wedges are generally approached with the aim of bullish reversal and so far, that’s what’s shown with last week producing the first weekly breakout from the resistance trendline making up the formation.
US Dollar - DXY Weekly Price Chart (indicative only, not available on Forex.com platforms)

Chart prepared by James Stanley; data derived from Tradingview
The Euro Connection, EUR/USD
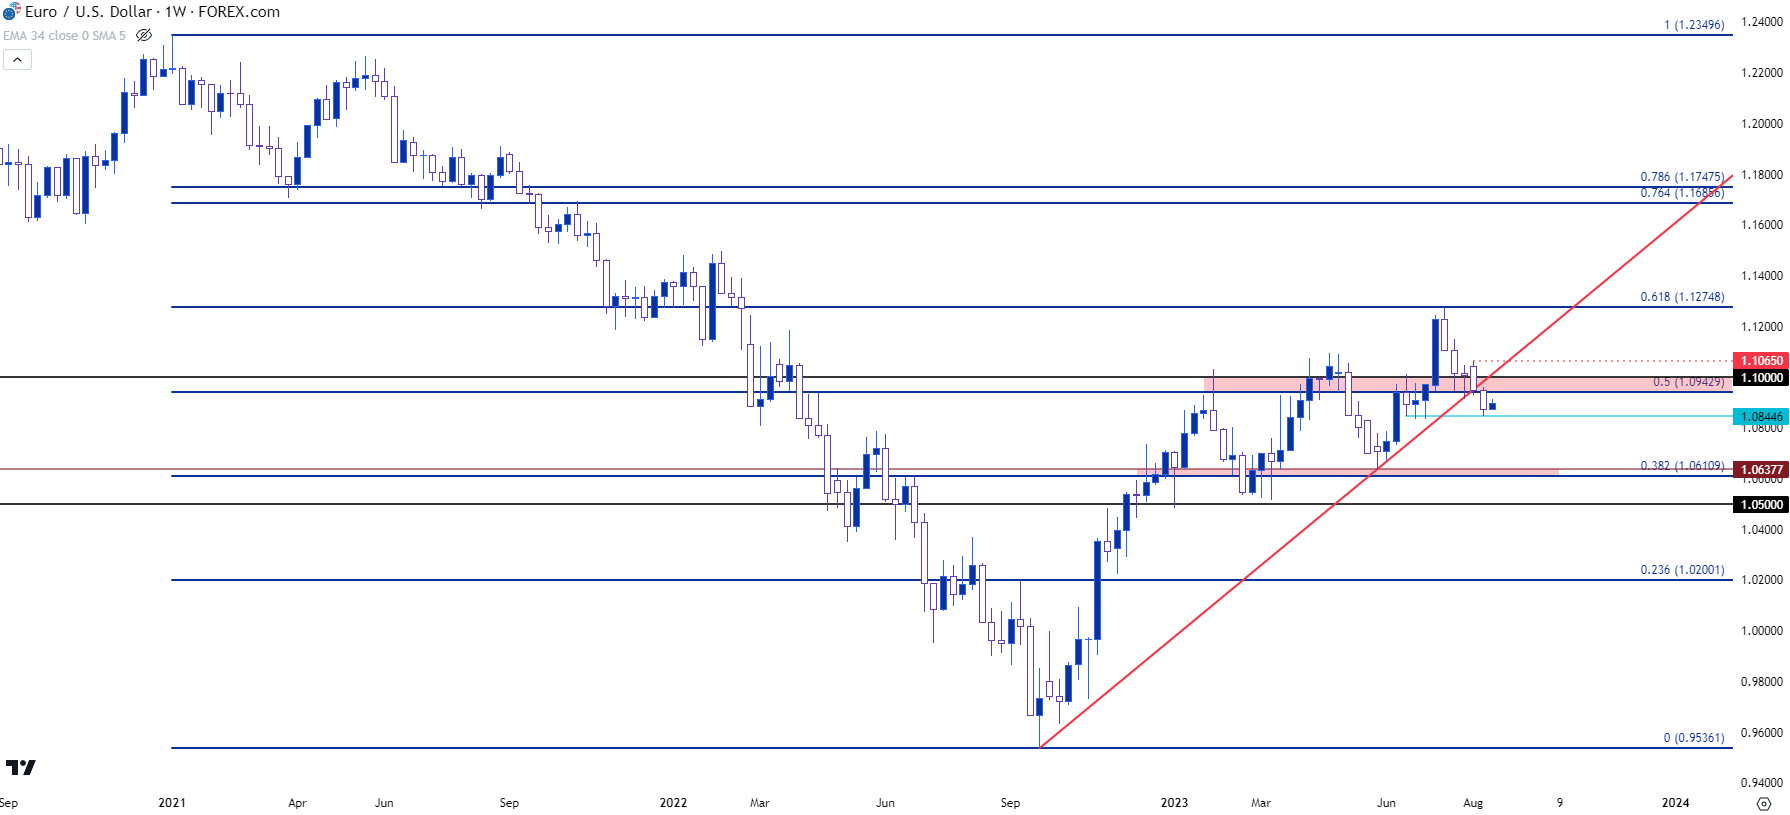
Given the relevance of the Euro to the DXY quote and to USD price action, it’s worth pointing out that the support response in the US Dollar syncs with resistance in EUR/USD. The current high in EUR/USD was set on Tuesday, July 18th right at the 1.1275 level, which is the 61.8% Fibonacci retracement of the 2021-2022 major move.
And as the USD breakout has now strung together five weeks of gains, we’ve seen a similar five weeks of losses in EUR/USD with price moving down to support at the late-June lows, around 1.0845.
Notably, and related to the bigger picture look in the USD, the bullish trendline that’s held the pair since the low was set last September has now been taken out, and this opens the door for shorter-term bearish approaches; but price would need to hold below the 1.1065 swing high to keep the sequencing of lower-lows and lower-highs intact.
EUR/USD Weekly Chart

Chart prepared by James Stanley, EUR/USD on Tradingview
USD Shorter-Term: Trendline Tango
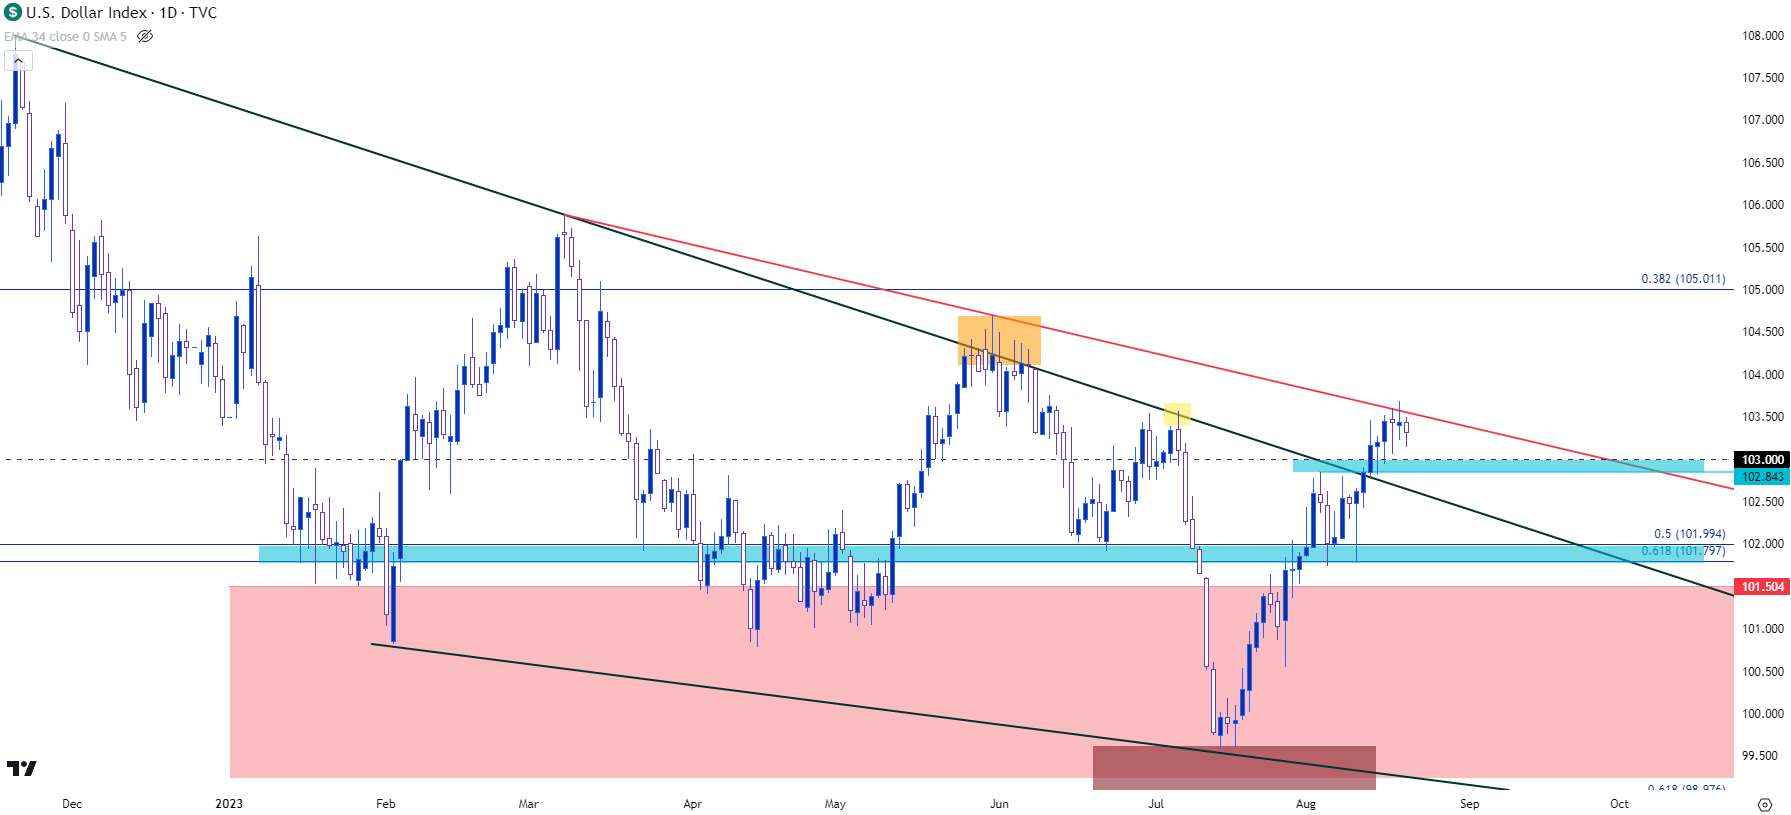
While we were in that consolidative state in the first half of the year, there was a bearish trendline that showed multiple resistance inflections. This makes up the topside of that falling wedge formation and there were a couple of tests of that trendline that kept bulls held back from breakout. The more notable test took place over a two-week-period in May and June, where that trendline was traded at for 9 of 10 days without a single daily close above. I’ve outlined this in the below chart in orange.
The next test of that trendline was treated much more crudely in early-July as that led to an almost immediate breakdown, which ran into the CPI report that was released in July. I’ve outlined that inflection in yellow below.
Bulls have now forced their way through that trendline, which I have plotted in green below, and there’s now another trendline coming into play to help hold the highs which I’ve drawn in red. That second trendline can be found by connecting the March and May swing highs and technically didn’t come to life until catching an inflection last week when the projection of that trendline came into play last Thursday and Friday. So far, that trendline is holding the higher-high in the DXY.
For support there’s a couple of key spots. The most nearby is the 102.84-103.00 area, which was prior resistance just before the breakout from the falling wedge formation. And below that, there’s another zone of support that runs between Fibonacci levels at 101.80 and 102. This was the zone that came into play after the most recent CPI report in August – and even though both headline and core CPI came in below expectations, exactly as they had in July, USD bulls used that pullback to bid the currency before pushing up to fresh highs and eventually the wedge break.
If bulls fail to hold the move above 101.80 on a daily close basis, the bullish theme will look like failure, very similar to the bearish move in July, and this would further place the USD back into a consolidative state.
US Dollar - DXY Daily Price Chart (indicative only, not available on Forex.com platforms)

Chart prepared by James Stanley; data derived from Tradingview
--- written by James Stanley, Senior Strategist


