EUR/USD Talking Points:
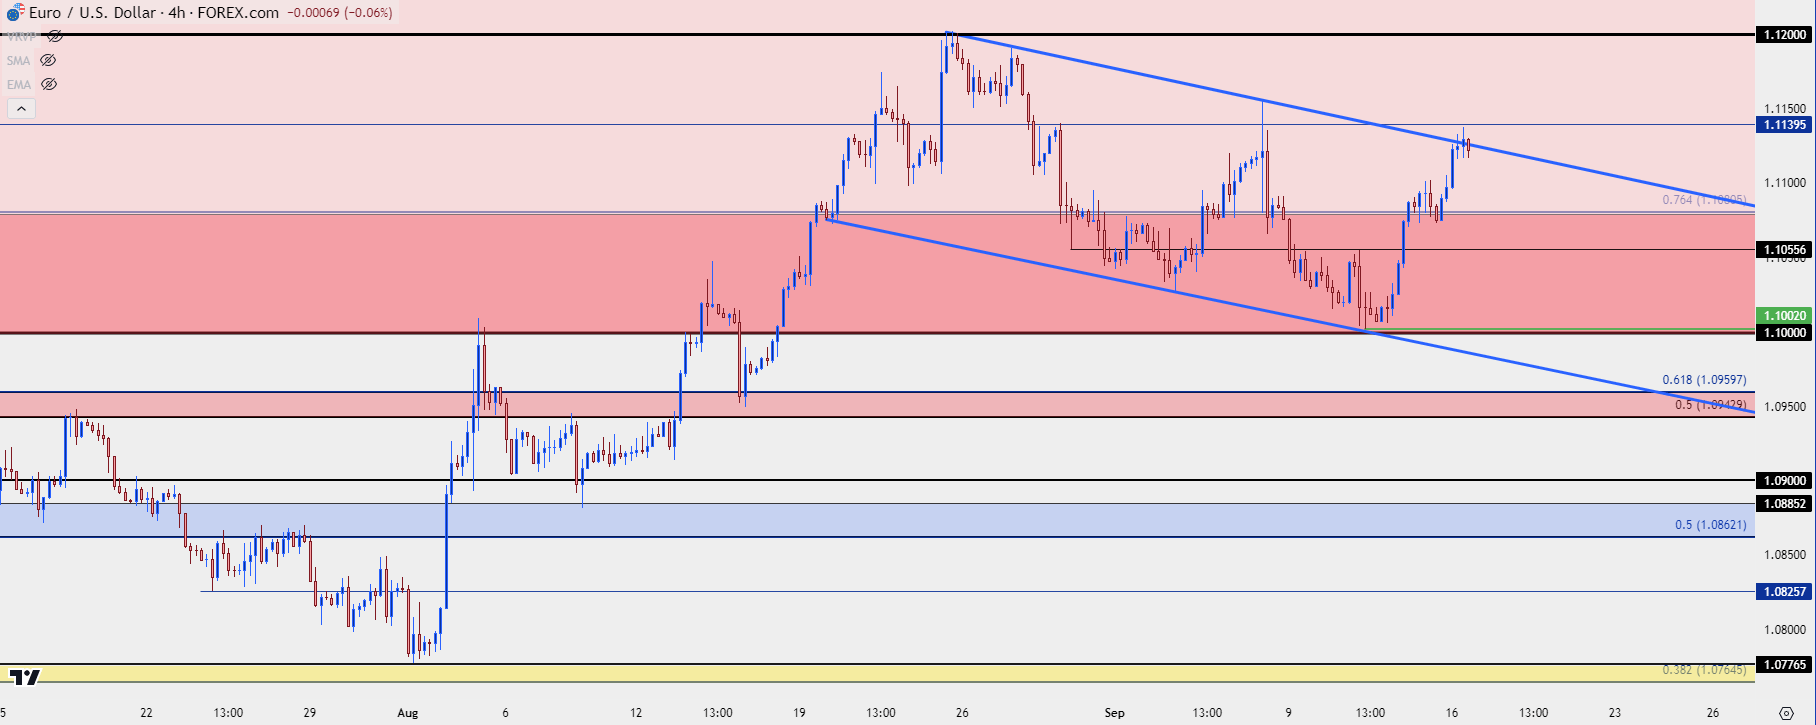
- EUR/USD put in a strong bounce after the Wednesday test of the 1.1000 handle. This took place after US CPI but before the ECB’s rate cut, which hastened the topside move.
- As looked at last Friday, the pair has set up a bull flag formation with a bearish channel atop a bullish trend that started in June.
- I’ll be looking into these setups in the Tuesday webinar and you’re welcome to join, click here for registration information.
It was a strong summer for EUR/USD and it didn’t look as though that would be the case at the outset. In the month of June, the pair dropped quickly below the 1.0700 handle, and it looked like there would soon be re-test of the 2024 low around the 1.0611 Fibonacci level. But two weeks of gyration to finish the month led to a strong run from the July open, with some help from a falling USD on the back of the dovish FOMC meeting at the start of that month. And then bulls just continued to push, eventually setting up a 1.1000 test in early-August. The pullback from that held higher-low support and once again, buyers pushed another fresh high in the pair, eventually running to the 1.1200 handle as RSI went overbought on the daily for the first time in 2024 trade.
Since that 1.1200 test, however, prices have been pulling back and we came very close to a 1.1000 support test last Wednesday. Buyers held the low two pips above the big figure after the US CPI release; and then the morning after saw another push from bulls.
To open this week the push continued, all the way into trendline resistance.
EUR/USD Four-Hour Price Chart
 Chart prepared by James Stanley, EUR/USD on Tradingview
EUR/USD Daily
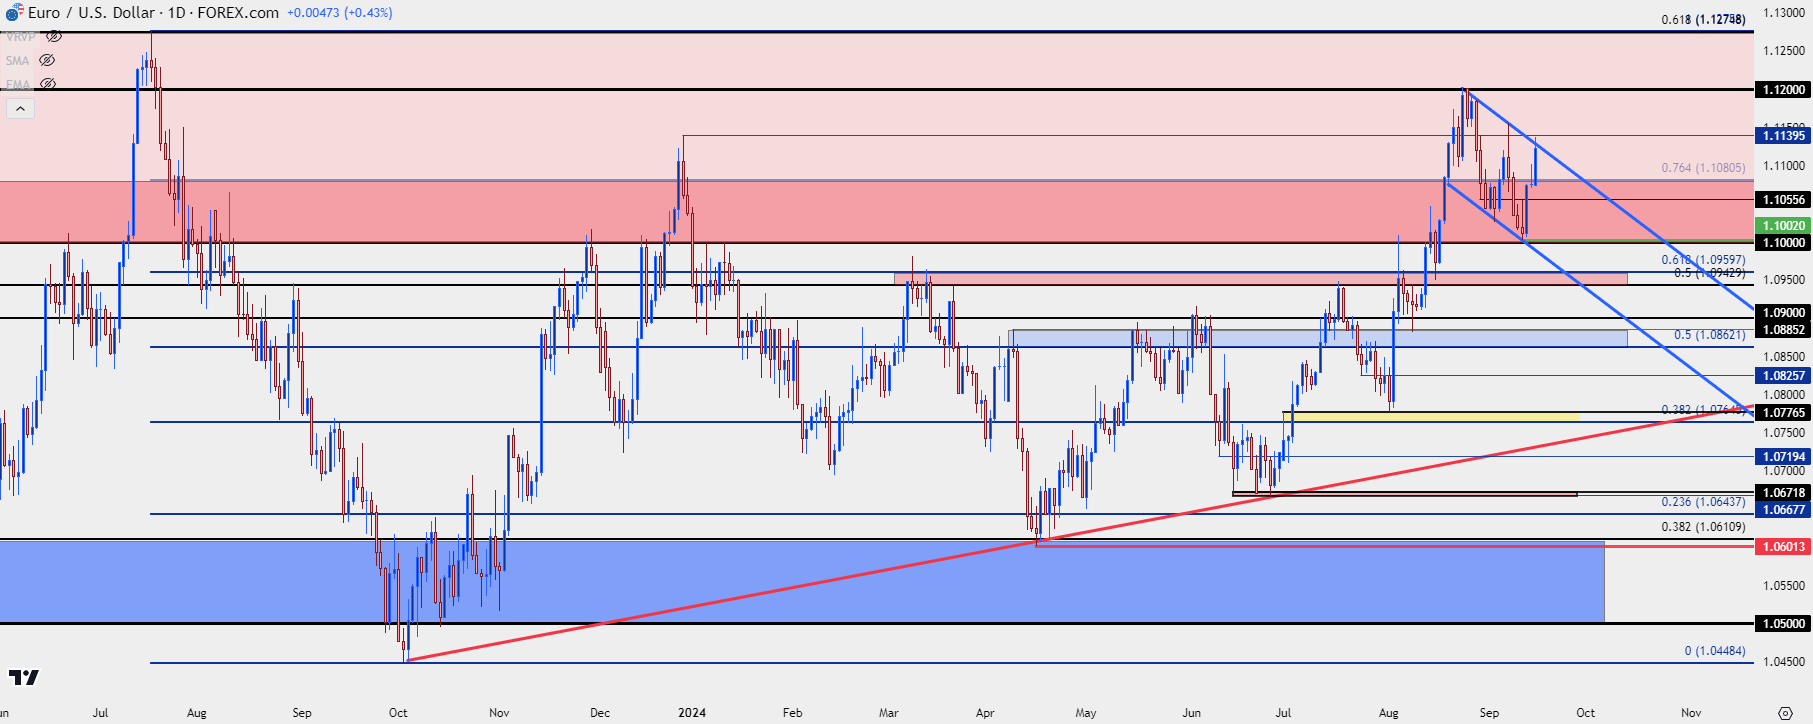
I looked into this on Friday, highlighting the rate cut rally that had helped to push the pair-higher with buyers defending the 1.1000 level.
I also highlighted a big level at 1.1140, which hasn’t yet come into play. This was the swing-high from December 28th of last year. Above that, the 1.1200 level looms and this is the current yearly high in the pair, and above that is the 1.1275 level that had set the high in 2023 trade. So there’s quite a bit of resistance sitting overhead and given how far price has moved above the 1.1000 level, this can be a tough move to chase given that context.
EUR/USD Daily Price Chart
 Chart prepared by James Stanley, EUR/USD on Tradingview
EUR/USD Shorter-Term
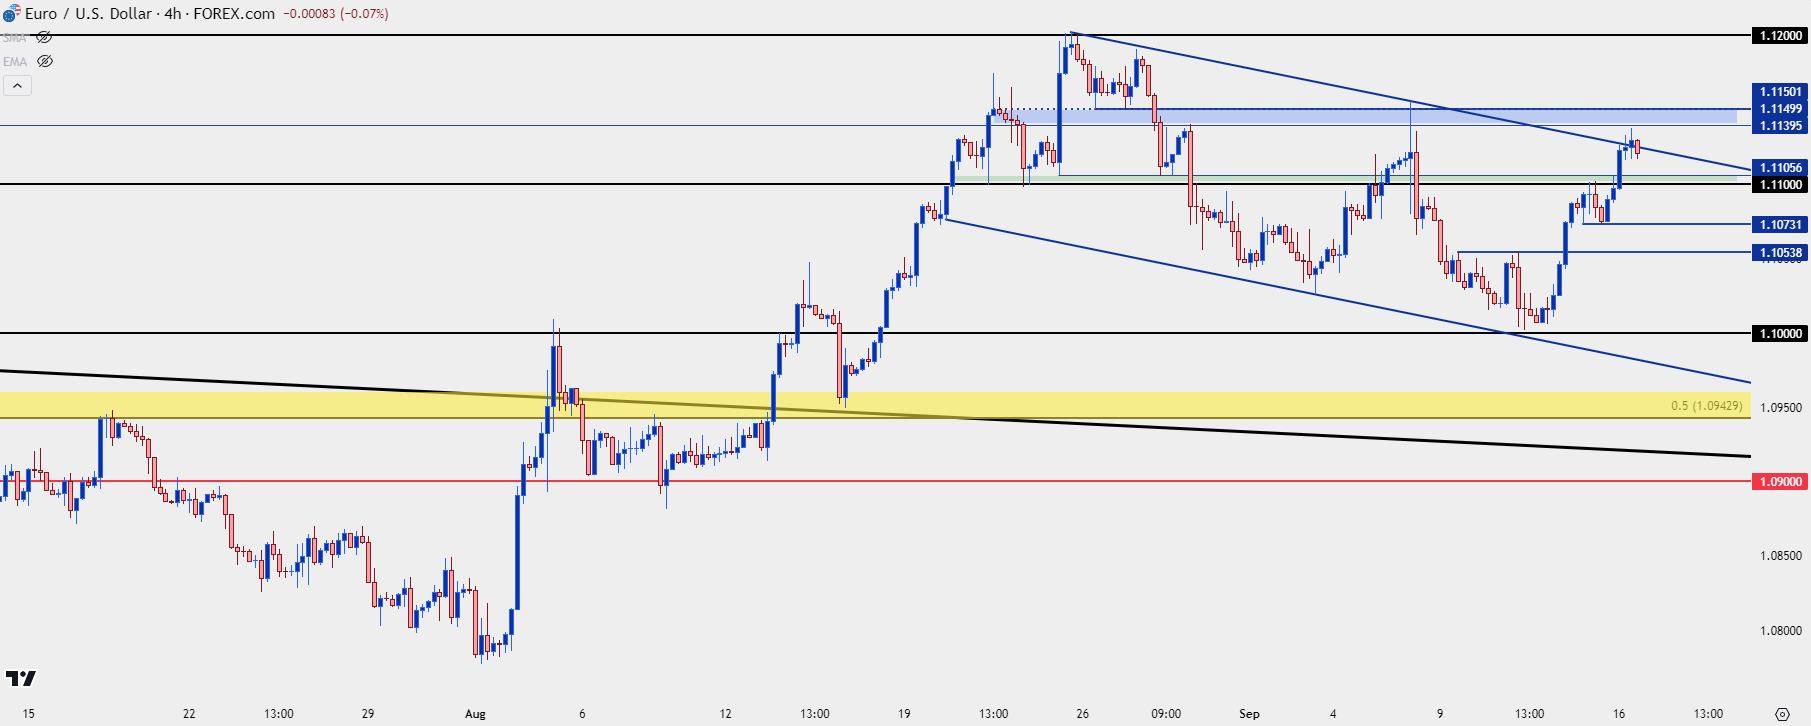
At this point we’ve seen a recent build of higher-highs and lows since the response above the 1.1000 level last Wednesday. This also provides some context for near-term levels that can be used for strategy, which I look at on the below four-hour chart.
The 1.1140 resistance level can be spanned up to 1.1150 which was a prior swing-low to create a resistance zone. For support structure, there’s a spot of resistance-turned-support around the 1.1100 handle, followed by the prior higher-low at 1.1073. This is followed by prior resistance at 1.1054 and, of course, the 1.1000 psychological level.
Given the FOMC rate decision on the calendar for Wednesday, some scenario planning could be of worth. If the 1.1000 level gets taken-out, the pair is going to have a bearish look, going along with what would probably appear to be support defense in the USD chart that I had looked at on Friday.
But – in EUR/USD there’s another major spot at 1.0943. That’s the 50% mark of the 2021-2022 major move and it’s related to the 1.1275 high that printed last year at the 61.8% retracement, and the low so far this year at 1.0611 that held at the 38.2% retracement. Notably that 1.0943 level was resistance while it helped to set the high in July but, as yet, hasn’t been tested for support since the August breakout.
EUR/USD Four-Hour Price Chart
 Chart prepared by James Stanley, EUR/USD on Tradingview
--- written by James Stanley, Senior Strategist


