Russian troops are building up on the Ukraine border. Thus far, they have amassed roughly 100,000 troops. As a result, the Russian Ruble is falling. Below are recent headlines as to why the Ruble is continuing to fall:
- The UK said on Monday that Russia is looking to replace the Ukraine President with a pro-Russian President.
- On Tuesday, the UK said that Russian advanced troops are already operating inside Ukraine.
- On Monday, the US put 8,500 troops on notice that they may be headed to Europe.
- The US asked the families of diplomats in Ukraine to leave.
- The US and the UK are discussing sanctions on Russian. The biggest sanction is a removal from the SWIFT system
Yet, Russia says the West is acting out of hysteria and that it has no intentions of invading Ukraine. Whether they will or not is irrelevant for the Ruble at this point. The Russian currency isn’t sticking around to find out. Traders have been selling the Ruble aggressively since the beginning of the year.
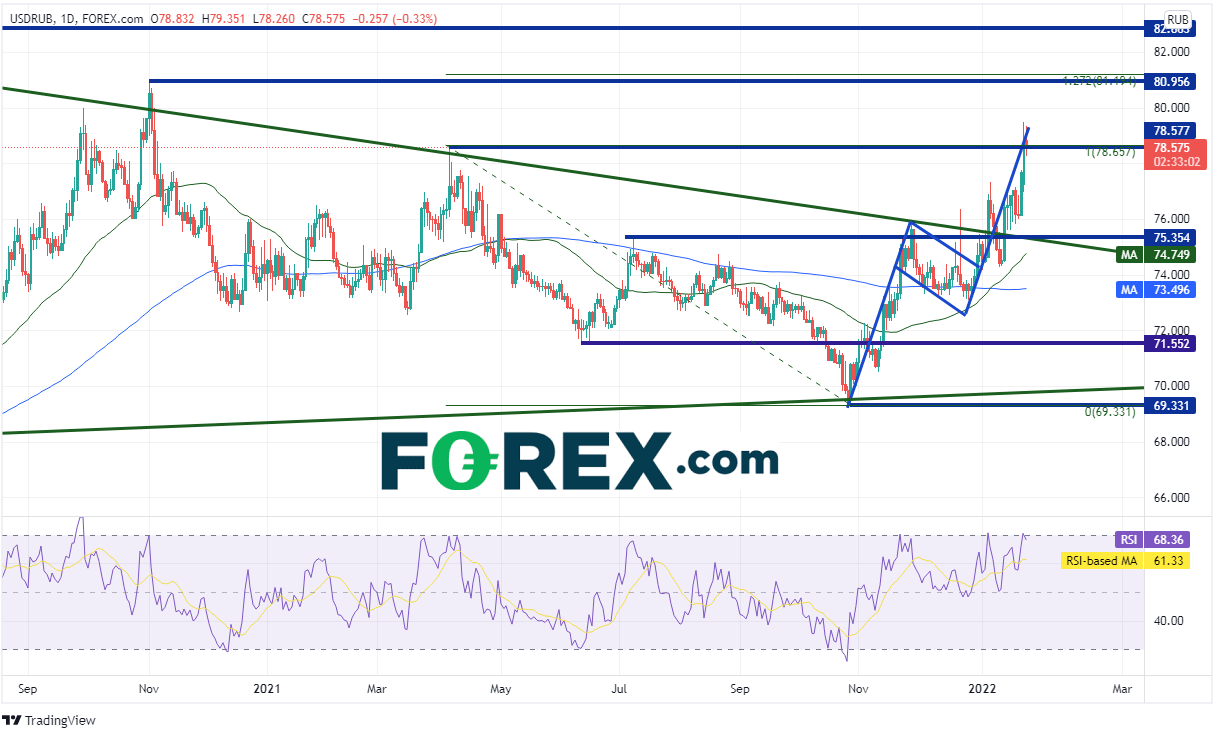
USD/RUB had been trading in a symmetrical triangle (green lines) since the beginning of the pandemic in early 2020. As price approached the apex, the pair began to form a flag formation just above the 200 Day Moving Average. It then broke above the top trendline of the triangle near 75.70. After a brief pullback to retest the trendline, USD/RUB was off to the races and hasn’t looked back since. Yesterday, price reached the target of the flag pattern, reaching a high of 77.77.

Source: Tradingview, Stone X
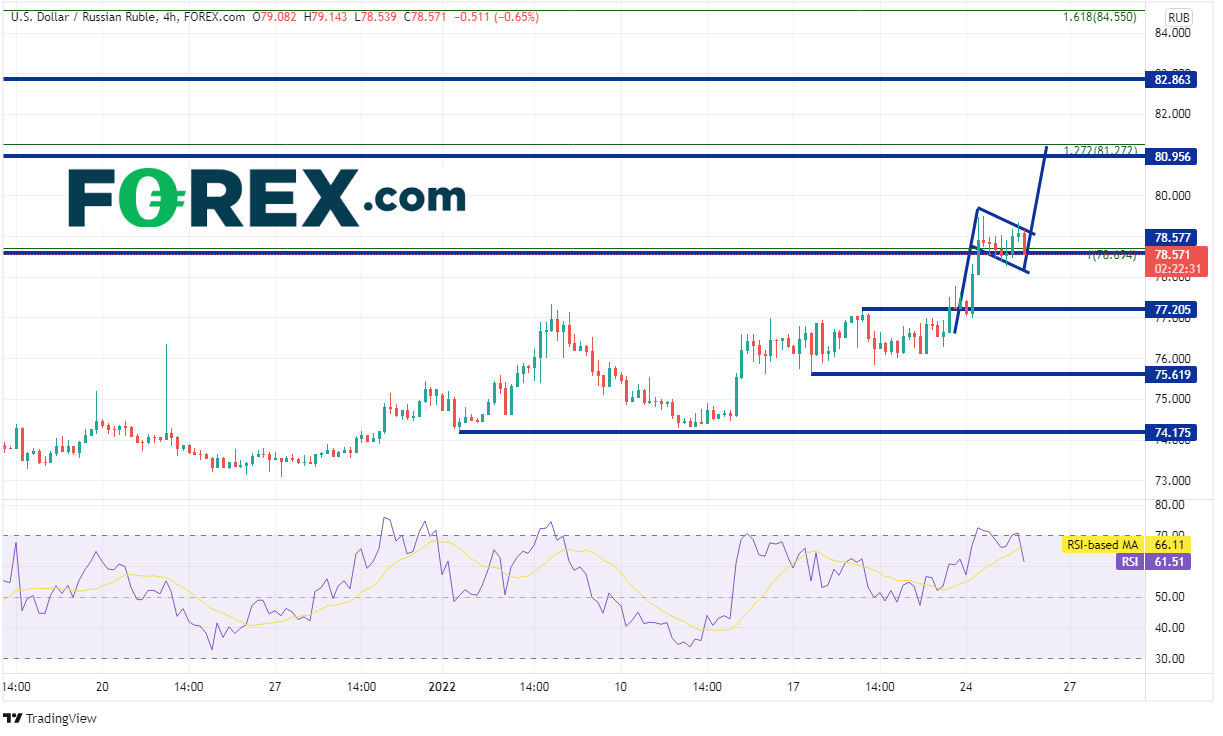
So where is the Ruble headed now? On a 240-minute timeframe, it appears as if USD/RUB is still headed higher, as it has formed a short-term flag formation. The target for the flag is near 80.25, which is also the 127.2% Fibonacci extension from the highs of April 5th, 2021 to the lows of October 26th, 2021. First horizontal resistance is at the highs of November 2nd, 2020 and then the highs from March 2020 at 82.86. If price does continue higher soon (for example, if Russian invade Ukraine), USD/RUB could be up at 84.42, which is the 161.8% Fibonacci extension from the recently mentioned timeframe. Price is currently trading near the first support level, the highs from April 6th, 2021, at 78.58. Below there, horizontal support is at 77.20 and 75.61, then the 50 Day Moving Average (see daily) at 74.75.

Source: Tradingview, Stone X
If the headlines continue to be negative regarding Russia invading Ukraine, it should provide a stronger reason for USD/RUB to move higher. After completing a flag on the daily timeframe, the pair appears to be forming another flag on the shorter 240-minute timeframe. Watch the 80.20 level for a flag target!


