After days of talks between Russia and NATO allies over Russian forces on the Ukraine border, both sides walked away without any kind of agreement. Russia will not begin discussions without NATO and the US meeting its demand that Ukraine will never be allowed to join NATO. Russia says this helps guarantee its security. Meanwhile, NATO was hoping to deescalate the situation on the Ukraine border, where Russia planted 100,000 troops and is threatening a ”catastrophic outcome” if their demands are not met, according to Russia’s Deputy Foreign Minister Sergey Ryabkov. And with that, the Russian Ruble tumbled.
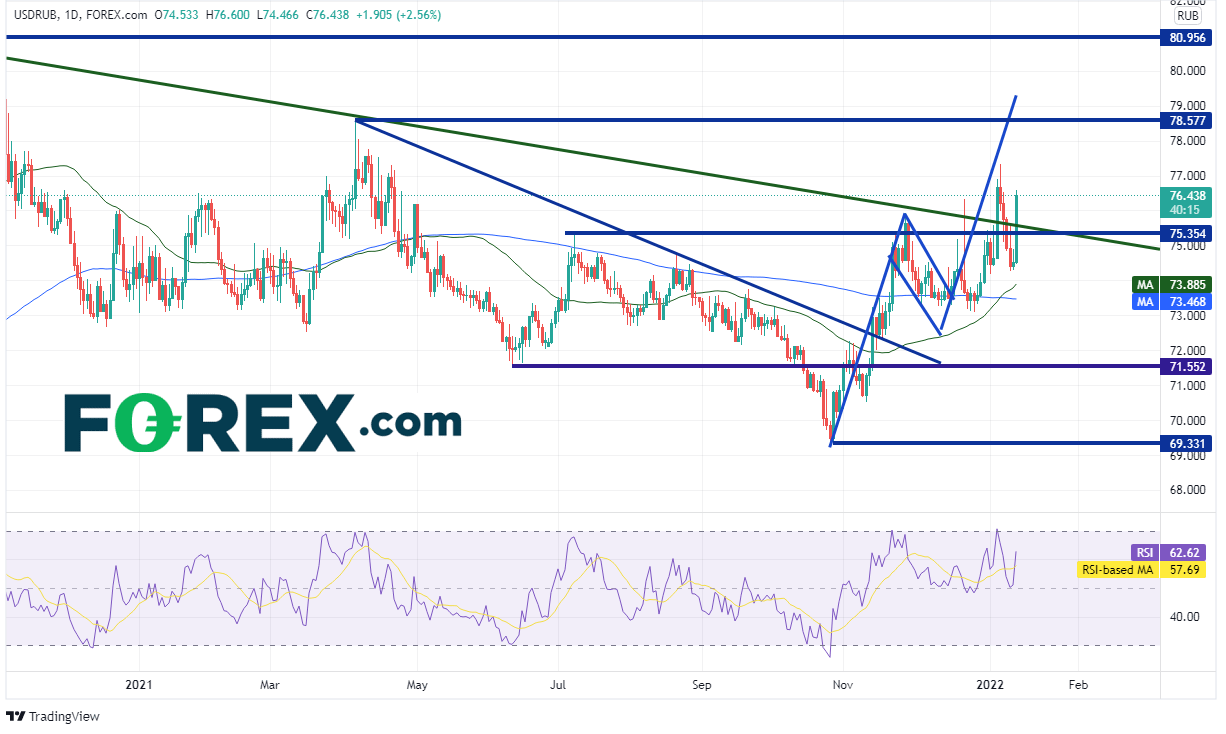
USD/RUB had been moving lower in a falling triangle (green lines) since March 2020 when the pair reached a pandemic high of 82.86. More recently, the pair broke above the 200- and 50-Day Moving Averages in mid-November 2021 and has held above them since. However, USD/RUB struggled to get above resistance at the downward sloping trendline of the triangle (green) at 75.63 and consolidated in a flag formation. In mid-December 2021, USD/RUB broke out of the flag pattern and has been oscillating around the triangle trendline since, all while remaining above the 200- and 50-Day Moving Averages at 73.46 and 73.88, respectively. On Thursday, after the comments from Ryabkov, USD/RUB broke back above the triangle trendline and is threatening to take out the January 6th highs at 77.34. The target for the flag pattern is above April 6th, 2021 highs near 79.25. Support below is at the 50- and 200-Day Moving Averages.

Source: Tradingview, Stone X
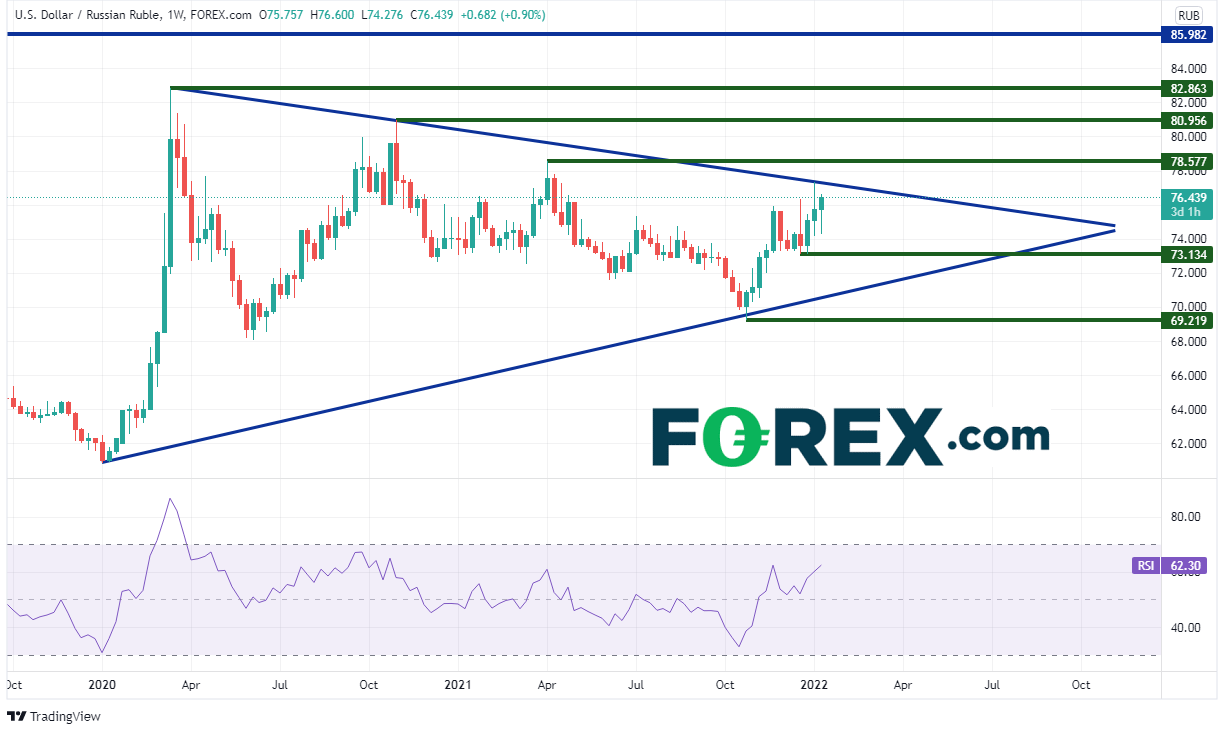
On a weekly timeframe, USD/RUB is trying to break out of a symmetrical triangle the pair which began forming in January 2020. If the threats from Russia continue, or if NATO and its allies refuse to give in to Russia’s demands, the pair can continue bid. The longer the bickering continues, the higher USD/RUB may go. Resistance is at last week’s high and the downward sloping trendline for the triangle near 77.34. Above there is horizontal resistance at 78.58, 80.96 and the March 2020 highs at 82.96. Final horizontal resistance is at the 2016 highs at 85.98. However, if the issues are resolved quickly, USD/RUB may pull back. Horizontal support on the weekly timeframe is at 73.13 and 69.22.

Source: Tradingview, Stone X
With talks between Russia and NATO ending without a resolution, tensions could continue to rise. If that’s the case, it may mean bad news for the Ruble, and USD/RUB could remain bid.


