US Dollar Talking Points:
- It’s been another bearish week for the USD with the majority of that weakness showing after the ECB’s rate decision on Thursday.
- The oversold reading on the weekly chart in late-August has led into the build of a range; but bulls haven’t exactly been able to capitalize thus far and threats of a larger breakdown in USD/JPY keep the door open for continued weakness. I think the prospect of deeper carry unwind is the big factor around the USD and DXY for next week. The USD/JPY pair has just started a test of a long-term zone of importance around the 140-handle.
- I’ll be looking into these setups in the Tuesday webinar and you’re welcome to join, click here for registration information.
The US Dollar’s bearish move has stalled after that oversold reading on the weekly chart in late-August. But, to this point, bulls haven’t exactly been able to take over as each push towards the 102 level in DXY has been faded and, in some cases, aggressively so.
This sets the stage for FOMC next week and the big point of consternation in the headlines is whether it’s a 25 or 50 bp cut. I think the dot plot matrix is more important, however, as this will highlight the Fed’s rate cut plans for the rest of the year and through 2025. The Fed has used forward guidance to many degrees through both the 2021 ‘transitory’ and the 2022 rate hike cycles. So, the scenario exists where the Fed only cuts by 25 bps but there’s still a bearish reaction in USD if the forecasts look dovish enough.
Perhaps more important for USD price action is what’s taking place in the constituents of DXY. After all, the DXY basket is a composite of underlying currencies and both the Euro and Japanese Yen have had some sway on the matter in Q3.
As I looked at earlier today, USD/JPY retains more carry unwind potential, in my opinion. And we’ve seen bounces in the pair grow more and more shallow, which could be highlighting increasing anticipation from sellers. The pair has just started to re-test a long-term zone of interest, spanning from the 140.30 swing low in late-December down to 139.28, which is the 38.2% Fibonacci retracement of the 2021-2024 major move that I’m looking at as the trend produced by the carry trade.
The Euro is a larger allocation at 57.6% of DXY but, similarly, Dollar-bulls failed to show much there this week, even as the ECB cut rates. Buyers held the low above the 1.1000 handle and a strong rally showed after the rate cut announcement. As I looked at earlier today, there’s even a possible bull flag in the pair which could keep the door open for re-test of 1.1200, or perhaps even the 1.1275 Fibonacci level that held the highs in 2023 trade.
From the Tuesday webinar, the pair I was most attracted to for USD-weakness scenarios was GBP/USD. That pair pushed down for a test of the 1.3000 level on Wednesday and I had published an article on it at the time. Bulls similarly showed up two pips ahead of the big figure and started to drive a rally, erasing earlier-week losses on a move up towards resistance at 1.3162.
At this point, the weekly bar in GBP/USD is showing a possible hammer formation which would further point to the potential for bullish continuation.
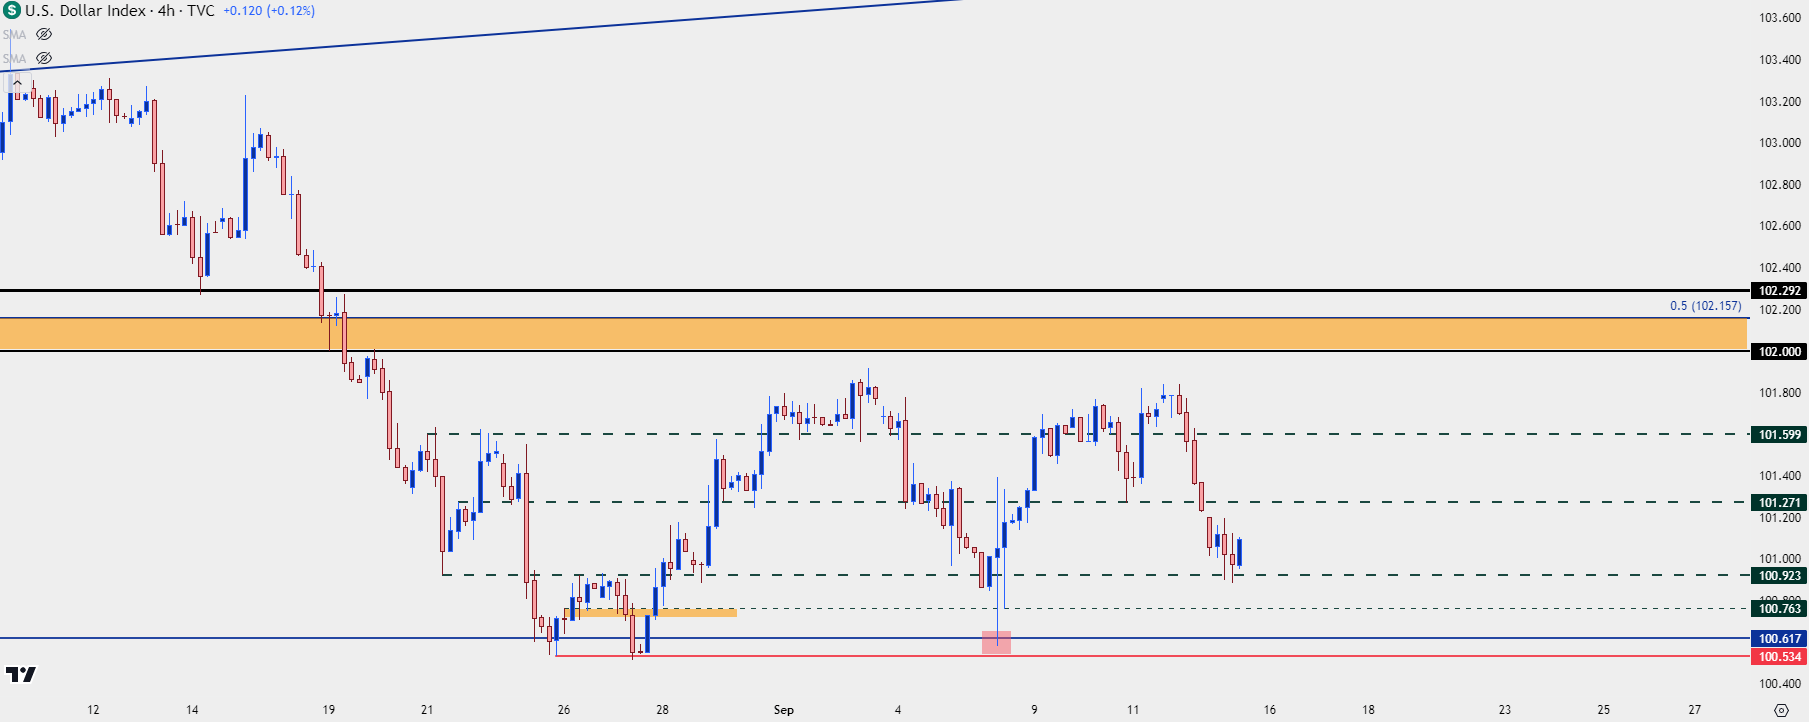
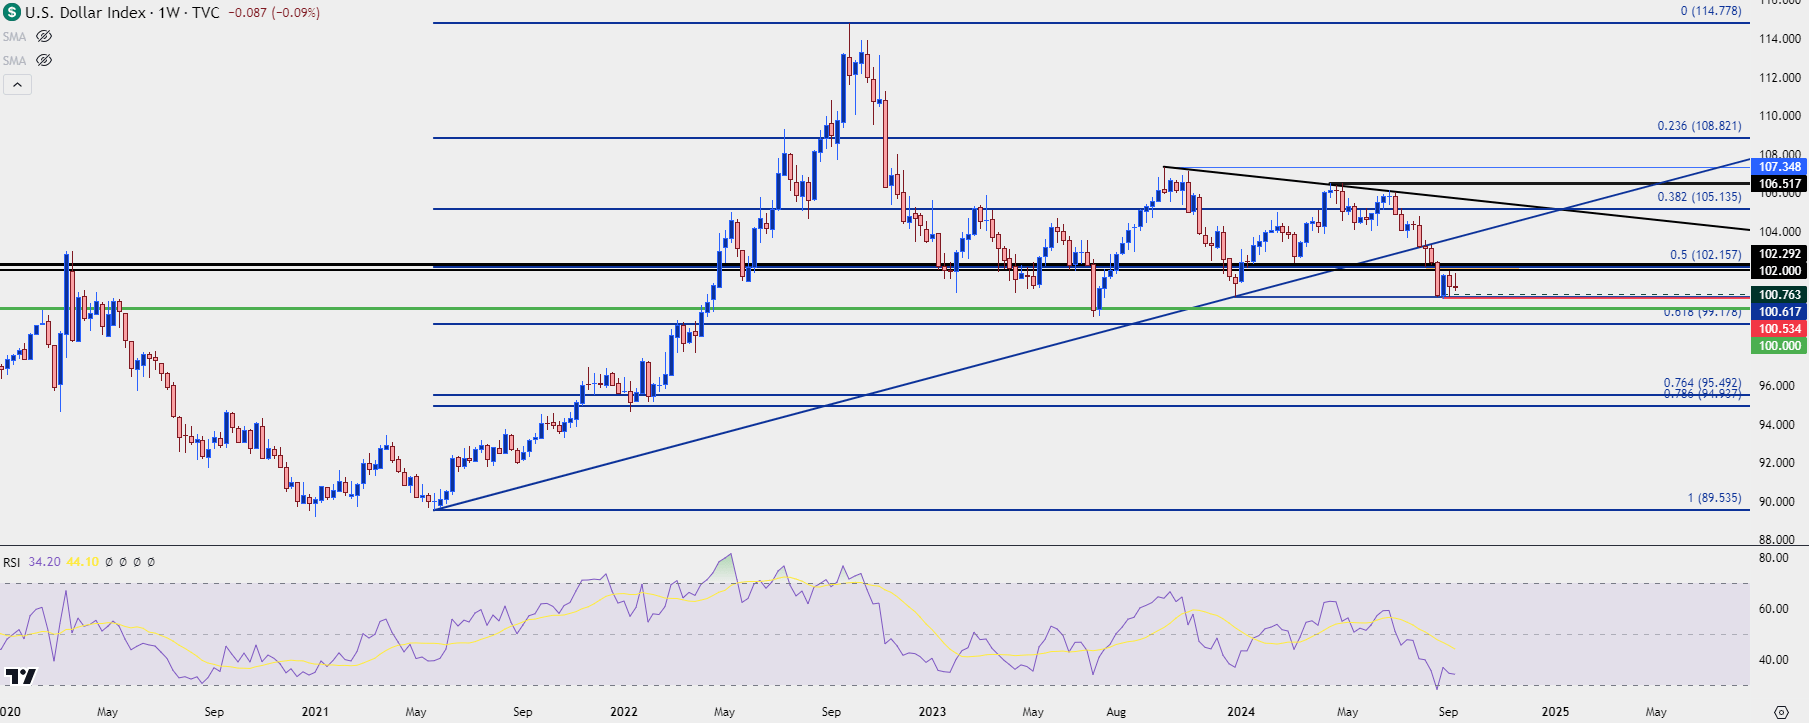
In the US Dollar, I'm still tracking near-term price action in the same range that’s been in-play since the oversold reading on the weekly in late-August. Last week produced a higher-low and so far this week, we’ve seen bulls step-in at 100.92, which would produce a second consecutive higher-low on the weekly chart of DXY.
US Dollar Four-Hour Price Chart
 Chart prepared by James Stanley; data derived from Tradingview
Fundamental Forces Around the USD
I’m expecting some relationship in USD/JPY carry unwind themes and expectations around rates for the FOMC. If there’s building expectation for more rate cuts around the Fed, the fundamental argument grows more and more bearish for USD/JPY, in my opinion. That could further compel longer-term carry unwind in the pair which, as we saw in July and August, could push as a large driver to USD themes of weakness, especially now that longer-term oversold readings are no longer an issue.
But – that story isn’t written yet, and the counter-scenario would be a hold of support around the 140.00 area in USD/JPY which could help the USD hold that support, and higher-lows, that’ve shown on the weekly. This could produce a test of the 1.1000 handle in EUR/USD and as I looked at in that article, there’s still very much a case for range continuation in the pair as prices remain inside of the 1.1200 swing-high from last month and the 1.1275 swing high from last year.
For USD-strength scenarios I’m still tracking the 102.00 zone in DXY as important. Bulls will have to break through that first to gain more traction. For bearish USD scenarios, I’m tracking next support at the 100.00 handle, followed by the 99.18 Fibonacci level.
US Dollar Weekly Price Chart
 Chart prepared by James Stanley; data derived from Tradingview
--- written by James Stanley, Senior Strategist


