Key Events for the Week Ahead
- Flash Manufacturing and Services PMIs
- US Advance GDP and Durable Goods Orders
- Fed’s preferred inflation gauge (PCE)
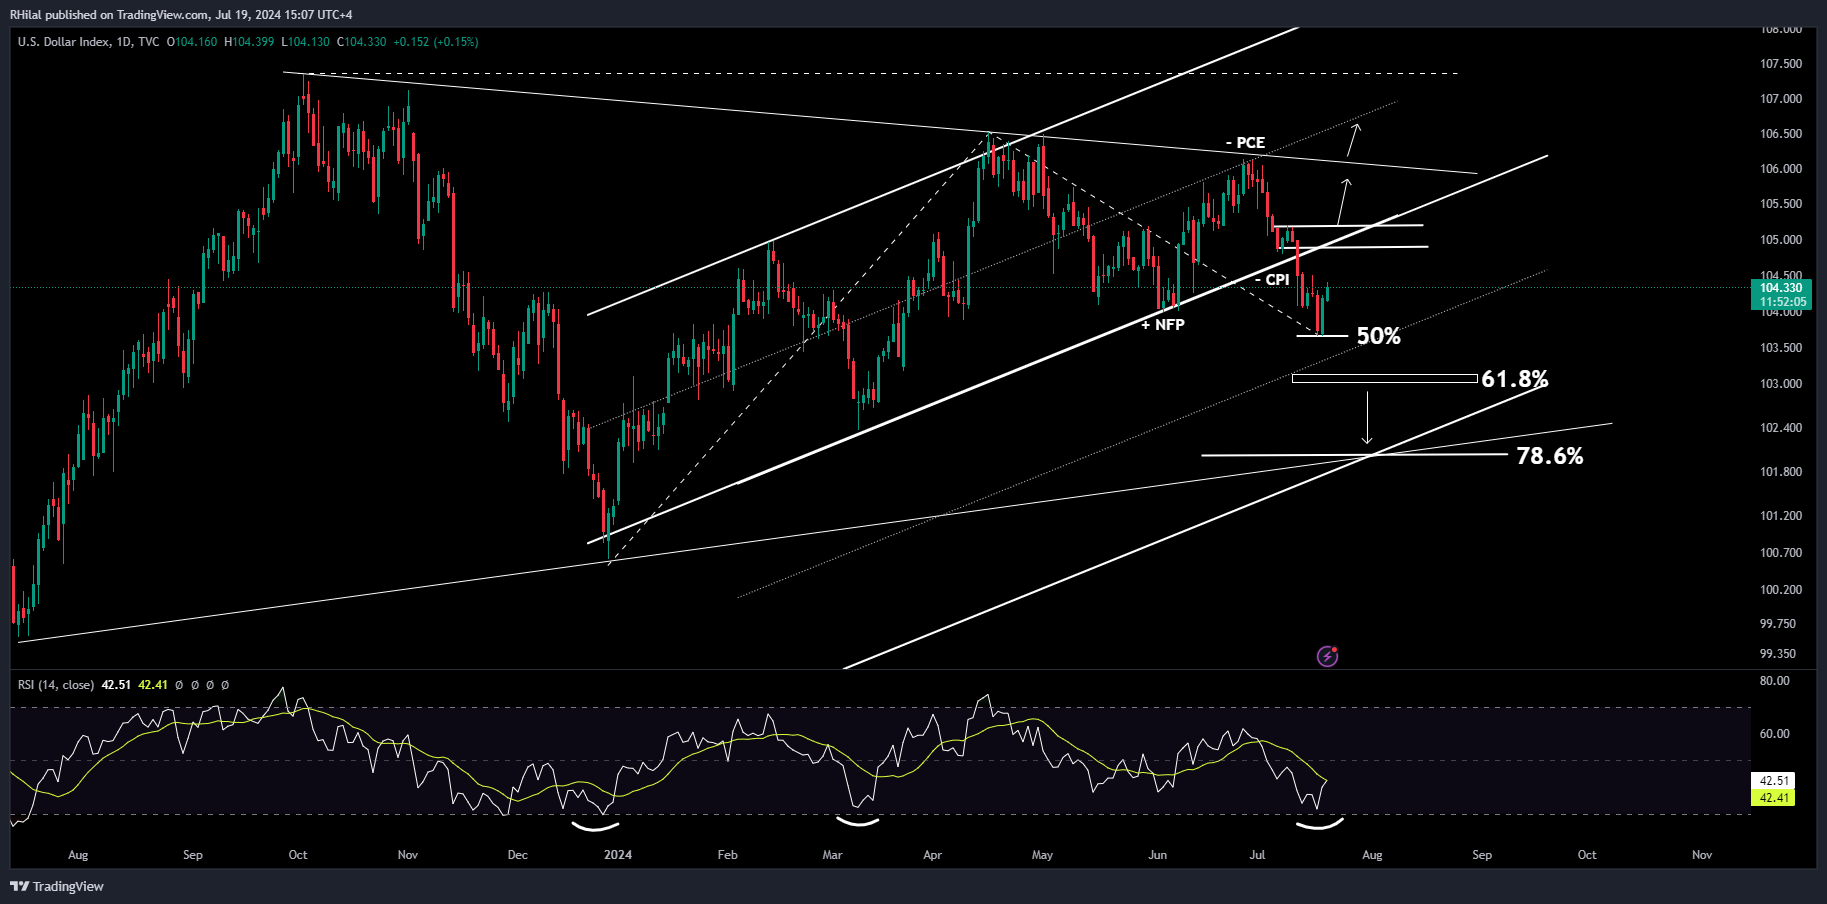
GBPUSD Forecast: DXY – Daily Time Frame – Log Scale

Source: Tradingview
From a momentum perspective, the DXY has rebounded from oversold levels following expectations of a rate cut. This rebound aligns with the 50% Fibonacci retracement of the yearly uptrend.
• Positive Rebound: Expected towards the trendline connecting the March and June 2024 lows. A close above 105.20 is needed to confirm a bullish continuation.
• Potential Drops: If the DXY falls below 103.65, it may align with the 0.618 and 0.786 Fibonacci retracements, near 103 and 102, respectively
• Key Event: Core PCE (Fed’s favored inflation gauge) reading. A drop below the recent 0.1% could amplify bearish sentiment, aligning with levels seen in 2020.
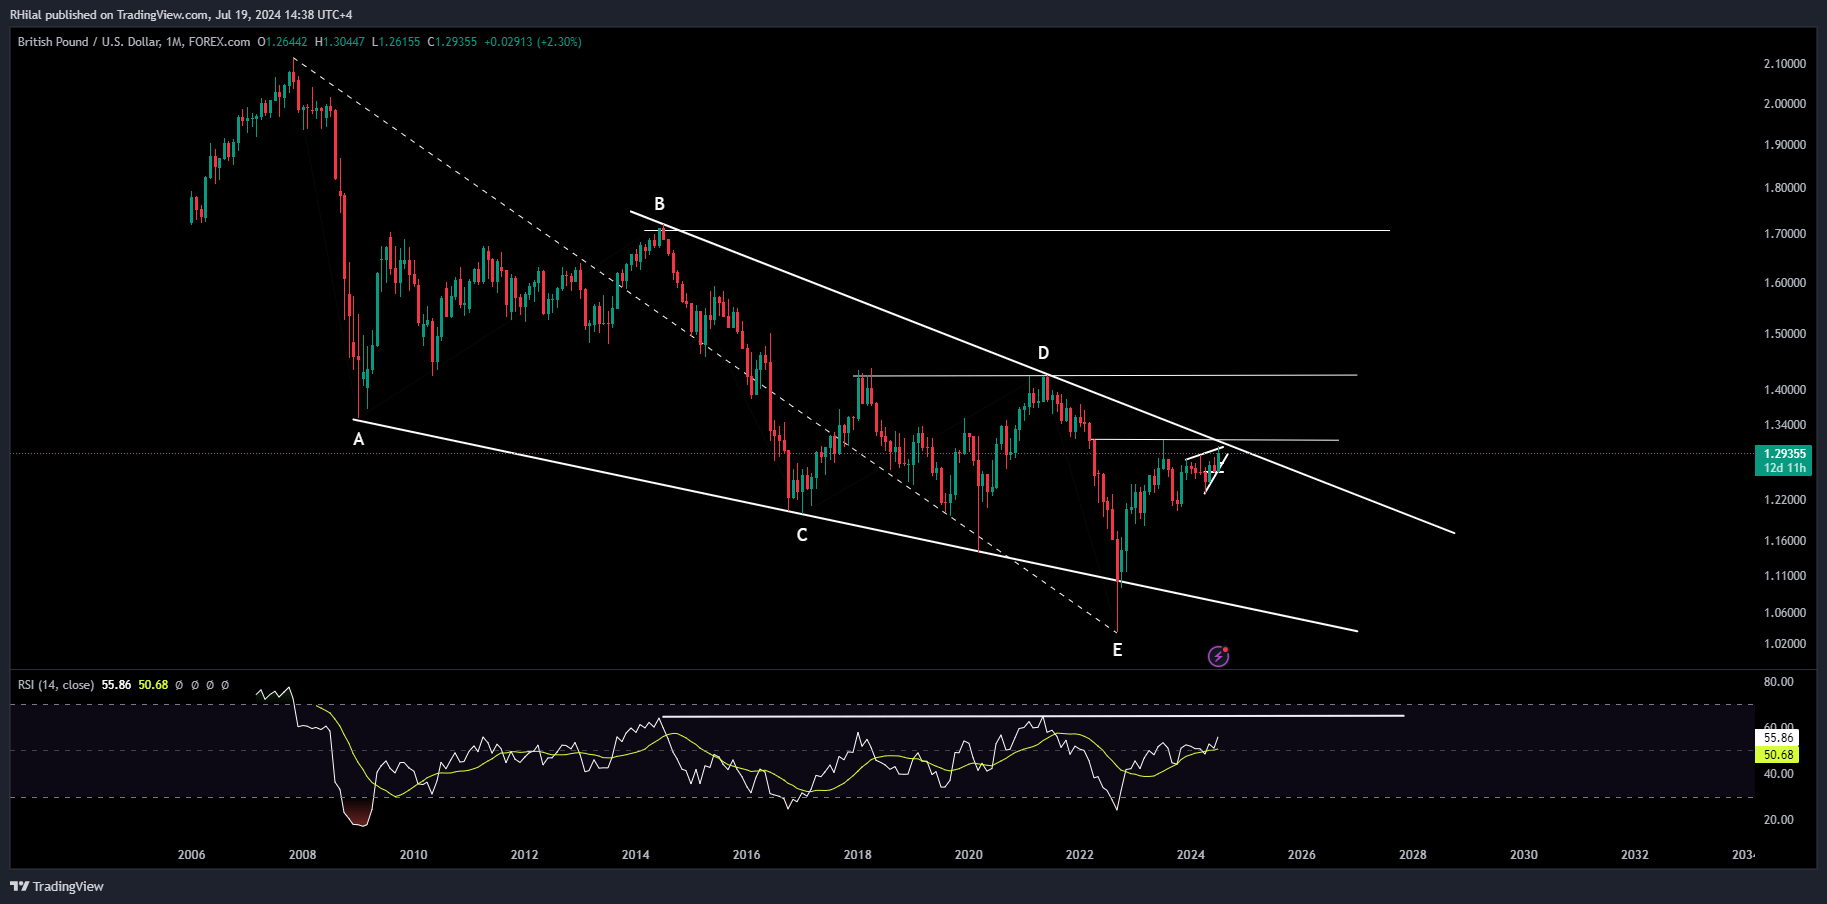
GBPUSD Forecast: GBPUSD – Monthly Time Frame – Log Scale

Source: Tradingview
Reaching the highlighted 1.3030 resistance zone, the GBPUSD’s uptrend managed to extend a wick towards the 1.3044 high, but closed at 1.30 before pulling back to the 1.29 zone.
The significance of the latest high aligns with a strong resistance level connecting the decreasing highs of 2014 and 2021, which also represents the upper border of a declining diagonal/ contracting down-trend, between 2008 and 2024.
A close above the 1.33 level is needed to confirm the bullish breakout out of the primary downtrend.
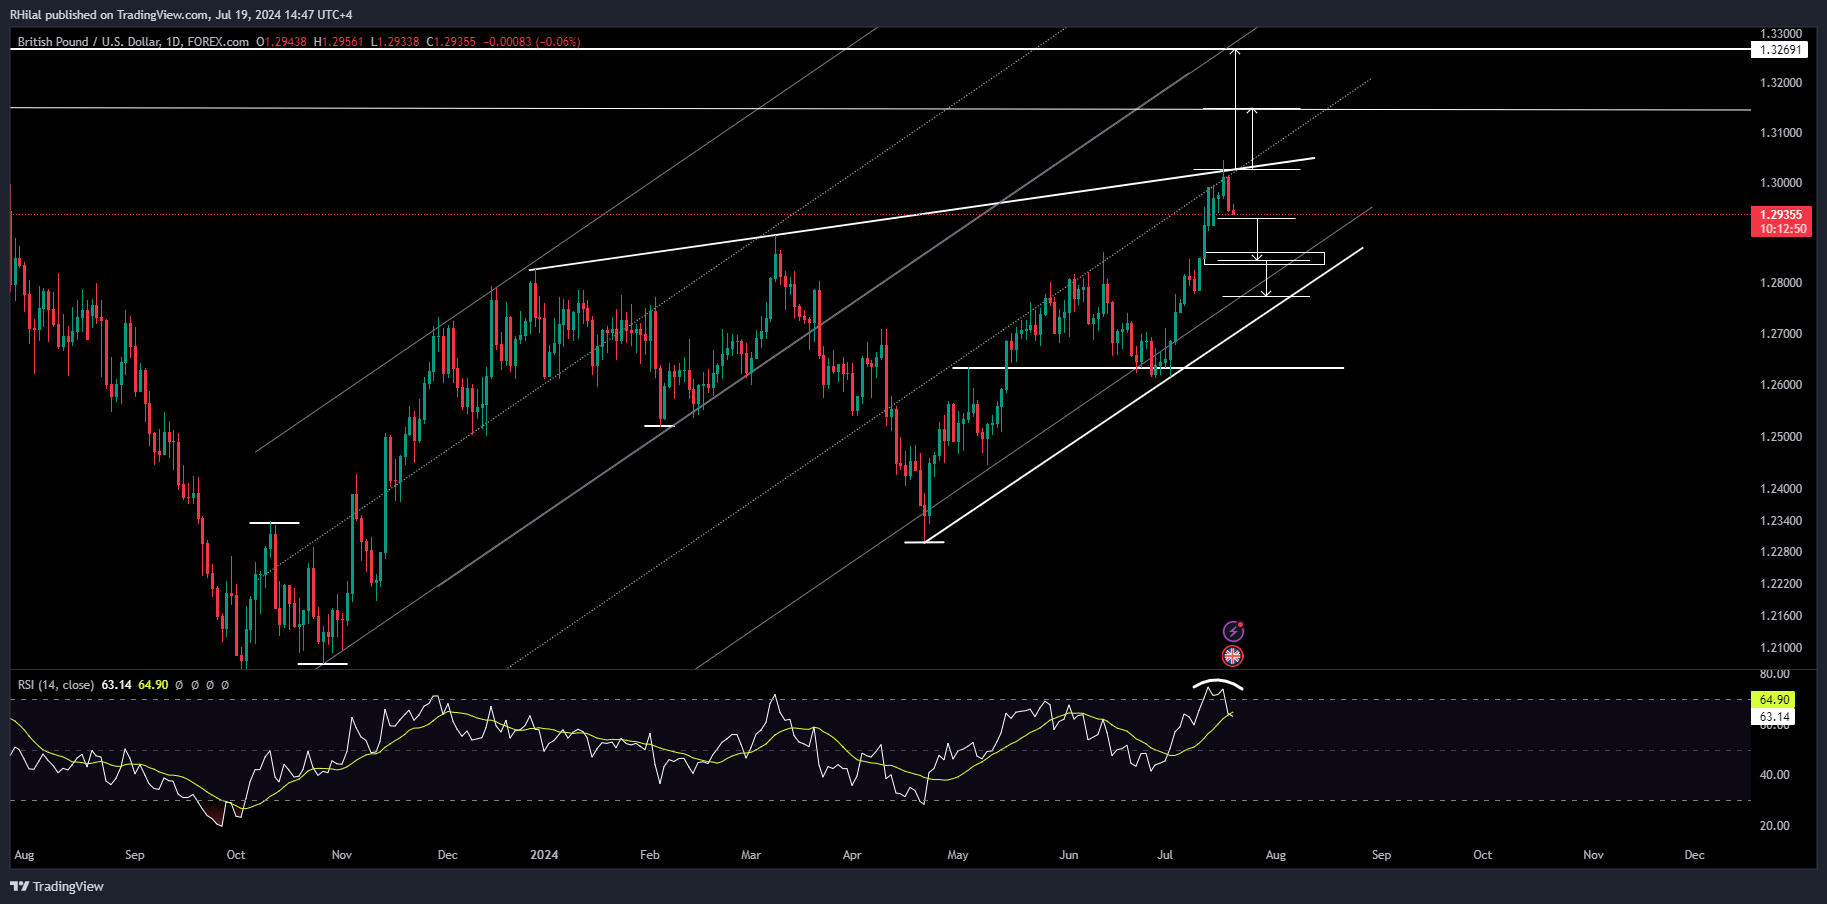
GBPUSD Forecast: GBPUSD – Daily Time Frame – Log Scale

Source: Tradingview
Along with the potential double top on the RSI indicator from the overbought zone, the chart reversed with a bearish engulfing pattern, and is headed towards the potential support zones:
Short term support: 1.2860 – 1.2840 zone
Longer term support: 1.2770 – 1.2760
A reversal back above the resistance line connecting the highs of December 2023 and March 2024, and more specifically a close above the 1.3030 can reverse the current bearish momentum with the following potential resistance levels in sight
Short term resistance zone: 1.3150
Longer term resistance zone: 1.3380 – 1.3790 – 1.42
--- Written by Razan Hilal, CMT


