Gold technical outlook: XAU/USD short-term trade levels
- Gold rebounds off near-term trend support- attempting third daily advance
- XAU/USD vulnerable to larger correction while below yearly high-day close
- Resistance 2004, 2040/50 (key), 2066/75– support 1969, ~1925, 1912/18 (critical)
Gold prices are up nearly 0.9% this week with XAU/USD attempting to rebound off multi-week trend support. The recovery may be short-lived however as the threat of a larger bull-market correction looms. These are the updated targets and invalidation levels that matter on the XAU/USD short-term technical charts heading into the close of the month.
Discuss this gold setup and more in the Weekly Strategy Webinars on Monday’s at 8:30am EST.
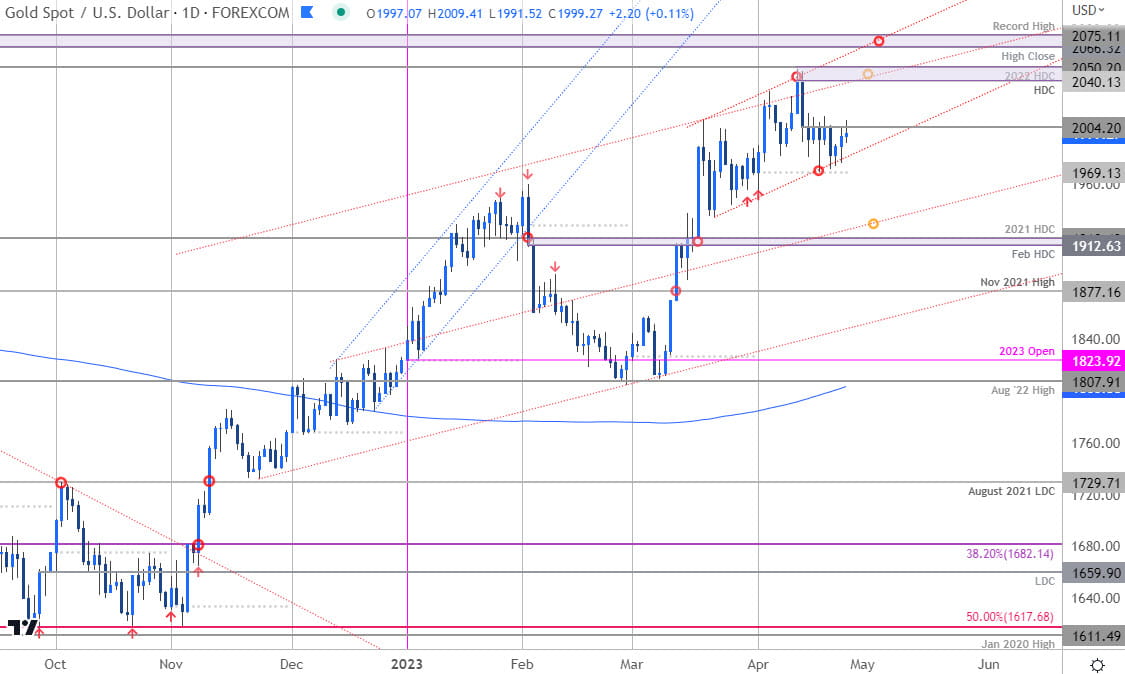
Gold Price Chart – XAU/USD Daily

Chart Prepared by Michael Boutros, Sr. Technical Strategist; XAU/USD on TradingView
Technical Outlook: In my last Gold short-term price outlook we noted that XAU/USD was approaching uptrend resistance with, “the threat for a larger pullback while below 2035.” Gold registered an intraday high at 2048 the following day before reversing sharply back into initial support at the April open. Since then, price has held a range between 1969 and the April 14th reversal close at 2004 – looking for a breakout of this zone (on a daily close basis) for near-term guidance with the risk still weighted to the downside while below the high-day close.
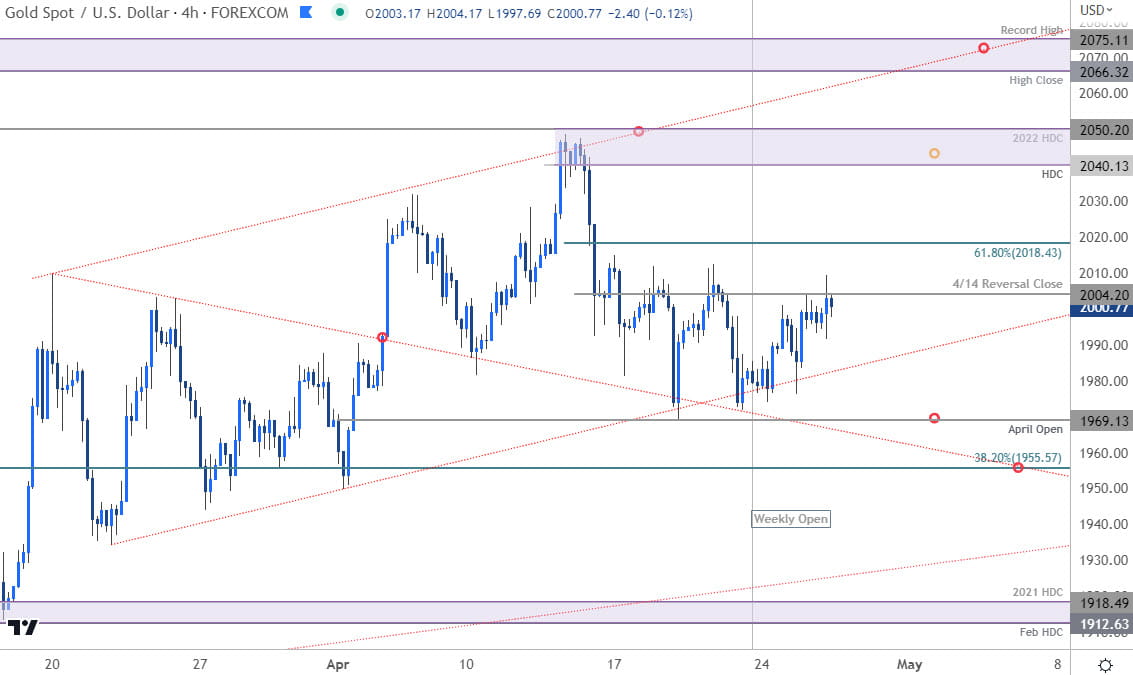
Gold Price Chart – XAU/USD 240min

Chart Prepared by Michael Boutros, Sr. Technical Strategist; XAU/USD on TradingView
Notes: A closer look at gold price action shows XAU/USD rebounding off near-term channel support this week. Initial resistance at 2004 backed by the 61.8% Fibonacci retracement of the recent decline at 2018- rallies should be limited to this zone IF price is indeed heading lower. Critical resistance stands at 2040/50– a region defined by the yearly high-day close and the 2022 high-day close. A topside breach / close above this zone is needed to mark resumption of the broader uptrend towards 2066/75 and beyond.
Monthly open support steady at 1969 backed close by the 38.2% retracement of the February advance at 1955- a break / close below this threshold would be needed to suggest a larger correction is underway with such a scenario exposing the lower parallel (red, currently ~1925) and key support / broader bullish invalidation at 1912/18- a region defined by the February / 2021 high day closes.
Bottom line: A multi-week rally into confluent uptrend resistance has faltered amid ongoing momentum divergence and threatens a deeper setback in gold prices. From a trading standpoint, rallies should be limited to 1918 near-term IF price is heading lower with a close below 1955 needed to clear the way for a larger correction within the broader uptrend. Stay nimble here into the close of the month. Review my latest Gold weekly technical forecast for a longer-term look at the XAU/USD trade levels.
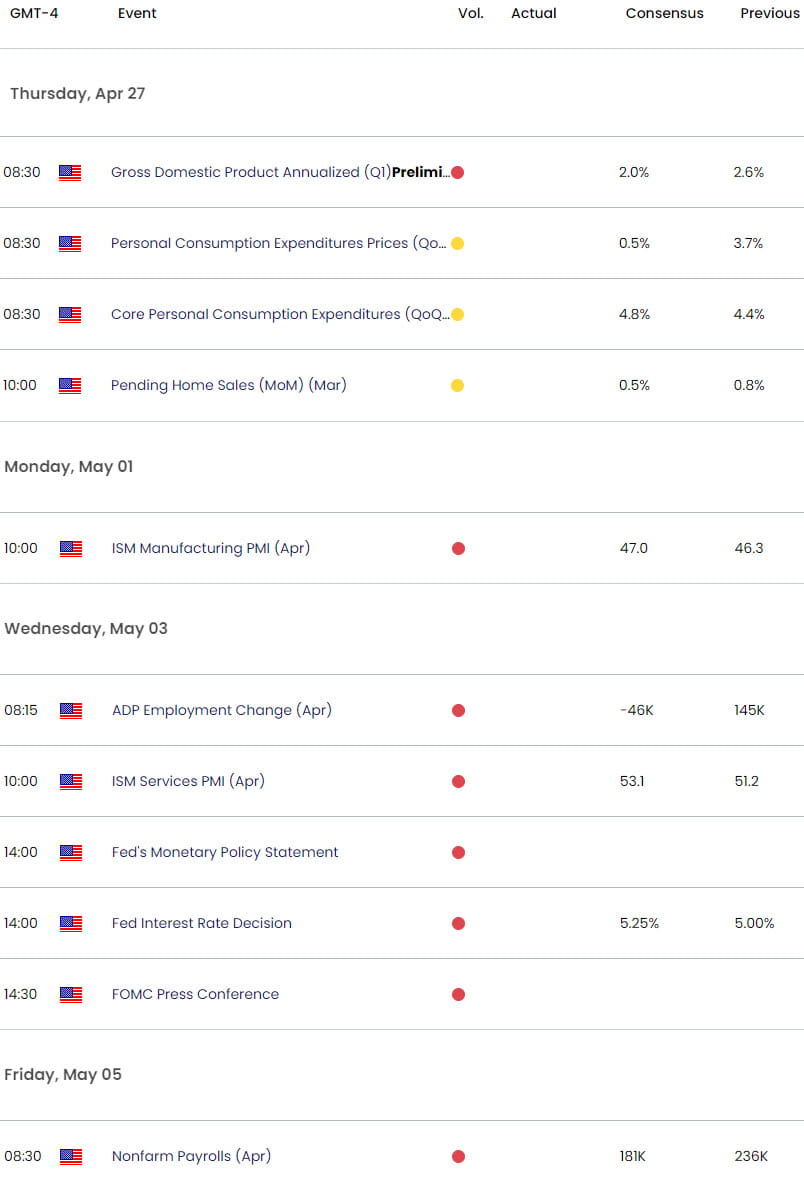
Key Economic Data Releases

Economic Calendar - latest economic developments and upcoming event risk.
Active Short-term Technical Charts
- Australian Dollar short-term outlook: AUD/USD bears emerge
- Japanese Yen short-term outlook: USD/JPY bulls blocked by 135
- Canadian Dollar short-term outlook: USD/CAD bulls emerge at support
- British Pound short-term outlook: GBP/USD threatens correction
- Euro short-term outlook: EUR/USD trend correction on the horizon
- US Dollar short-term outlook: USD collapses to yearly low- DXY levels
--- Written by Michael Boutros, Sr Technical Strategist with FOREX.com


