Asian Indices:
- Australia's ASX 200 index rose by 64.9 points (0.93%) and currently trades at 7,047.60
- Japan's Nikkei 225 index has risen by 528.72 points (1.92%) and currently trades at 27,975.34
- Hong Kong's Hang Seng index has risen by 269.76 points (0.97%) and currently trades at 27,988.43
UK and Europe:
- UK's FTSE 100 futures are currently up 44.5 points (0.64%), the cash market is currently estimated to open at 7,007.83
- Euro STOXX 50 futures are currently up 31 points (0.79%), the cash market is currently estimated to open at 3,983.45
- Germany's DAX futures are currently up 118 points (0.78%), the cash market is currently estimated to open at 15,317.68
Thursday US Close:
- DJI futures are currently up 120 points (0.35%), the cash market is currently estimated to open at 34,141.45
- S&P 500 futures are currently up 83 points (0.63%), the cash market is currently estimated to open at 4,195.50
- Nasdaq 100 futures are currently up 18.75 points (0.46%), the cash market is currently estimated to open at 13,127.90
Learn how to trade indices
The Fed calm market jitters
Markets had been concerned with rising inflation and producer prices, but Fed members quelled fears and stuck to their ‘transitory’ guns, allowing equities to rise after a three-day retracement. Separately, a Reuters poll shows that economists think the Fed would withstand core PCE (the Fed’s preferred gauge of inflation) to rise to 2.8% for three month before feeling discomfort. The latest read is just 2% YoY, up from 1.8%, so this leaves plenty of upside inflationary pressures to materialise before the Fed acts, if respondents are correct. Either way, barring something unexpected we go into today’s session on a positive note as we head into the weekend.
- The STOXX Euro 50 printed a bullish pinbar after finding support at its 50-day eMA. A break above yesterday’s high confirms the near-term bullish reversal pattern.
- The DAX printed a bullish engulfing candle (which could pass as a hammer with a wide open to close range). A break above 6305 clears the 10-day eMA and assumes bullish continuation. Also take note of the double bottom pattern around 15,000.
- The FTSE also printed a bullish hammer at its 50-day eMA, and quite a volatile one at that. A break above 7028 clears the 10-day eMA and Wednesday’s high, although from a reward to risk perspective the STOXX 50 looks a bit more appealing.
FTSE 350: Market Internals

FTSE 350: 6963.33 (-0.59%) 13 May 2021
- 155 (44.16%) stocks advanced and 183 (52.14%) declined
- 1 stocks rose to a new 52-week high, 16 fell to new lows
- 80.91% of stocks closed above their 200-day average
- 8.26% of stocks closed above their 20-day average
Outperformers:
- + 14.2% - NCC Group PLC (NCCG.L)
- + 5.43% - Elementis PLC (ELM.L)
- + 4.87% - Network International Holdings PLC (NETW.L)
Underperformers:
- -6.31% - John Wood Group PLC (WG.L)
- -6.00% - Cineworld Group PLC (CINE.L)
- -5.92% - BT Group PLC (BT.L)
Forex: USD/CHF is Coiling at Trend Support

USD/CHF trades in an established downtrend, and recent highs formed in the zone between the 50 and 100-day eMA which, along with the 200-day eMA, all point lower.
The Swissy rolled over at 0.9093 resistance and formed a two-bar bearish reversal yesterday (Dark Cloud Cover). Whilst the pattern needs a break of Wednesday’s low to confirm the pattern, overnight trade has found support at a retracement line projected from this week’s low.
- If trendline support continues to hold then bullish targets become 0.9075 and 0.9093.
- However, a break beneath 0.9045 (yesterday’s low) invalidates the retracement line and could confirm a bearish breakout, bringing 0.9200 and 0.9000 into focus.
The US dollar index (DXY) traded in a tight range, within yesterday’s Rikshaw Man doji. That it struggled at its own week to-date high is a little concerning for bulls heading into the weekend, although dollar bears may want to check out USD/CHF as a proxy for the dollar index (see today’s chart below)
GBP/CHF closed back beneath its 1.2736 breakout level after a bearish pinbar found resistance at the April 20th high. With prices coiling up overnight, we’d take a break of yesterday’s low as a suggestion that its next leg lower is underway.
GBP/USD fell to our countertrend target of 1.4000 yesterday and formed a Spinning Top Doji on the daily chart. Whilst 1.4000 holds as support then the risks remain for a bounce towards 1.4000, whilst a break of yesterday’s low out of its current consolidation likely marks the beginning of its next leg lower.
Metals try to find their corrective lows
Our bias remains bullish on gold above 1800, although a four-hour bullish engulfing candle formed at 1808.40 to show demand at this level, so perhaps the corrective low is in place already. Silver is also trying to carve out a low after forming a Doji above 26.63 support. If it can break above 27.20 today then we’d have more conviction its correct from its highs was complete and that momentum had realigned with its bullish channel.
Up Next (Times in BST)

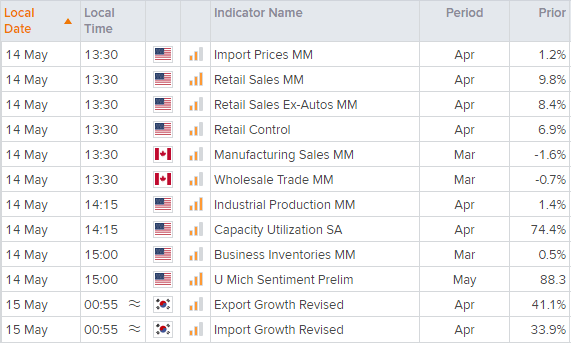
On the data front, import prices are released at 13:30 BST in the US and, unless they show a noteworthy rise, perhaps equities will manage to rally into the weekend after all. Retail sales, industrial production, capacity utilisation, business inventories and consumer sentiment are also on the bill for the US, whilst Canada release manufacturing sales and wholesale trade.
You can view all the scheduled events for today using our economic calendar, and keep up to date with the latest market news and analysis here.


