The long-awaited Summer 2020 Olympics began today with opening ceremonies and less than 1000 fans in the stands. The city of Tokyo itself is under a State of Emergency for the next month due to the coronavirus. Of the over 11,000 athletes participating in the summer games, less than half participated in the opening ceremonies. After a year delay due to the pandemic, organizers were hoping for an event full of triumph. Instead, they are dealing with a subdued Games and worried athletes. Nearly 100 athletes have already been sent packing as a result of testing positive or being exposed to the virus.
Holding the Olympic games this year was not a popular decision among the residents of Japan. Many fear that it could only worsen the pandemic, especially with the more contagious Delta variant making its way thought the host country. Corporate sponsors, such as Toyota, Motorola, and Panasonic didn’t send representatives to the games. Toyota even went as far as to pull Olympic-themed commercials in Japan during the games. What if they are right? What will this due to Nikkei if the Olympics turns into a super-spreader in Japan?
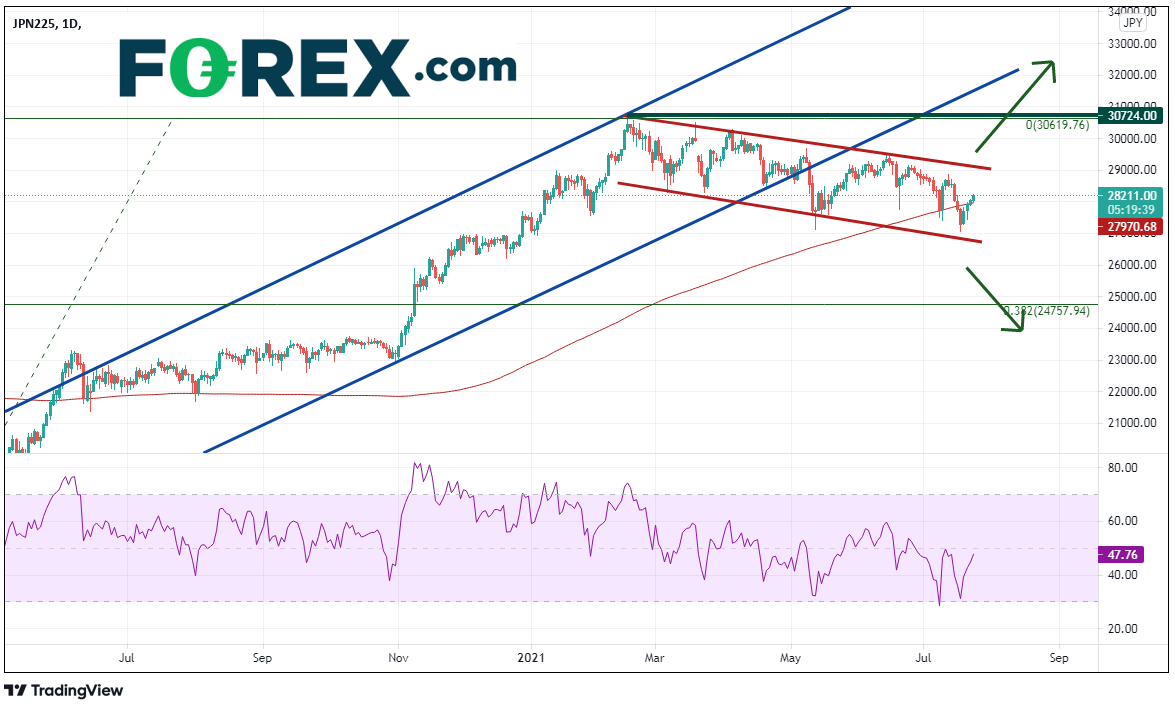
Japan’s Nikkei 225 had been moving in an orderly, upward sloping channel (blue) since putting in pandemic lows in March 2020. The stock index peaked on February 16th at 30,724. Since then, the Nikkei has pulled back and broke below the upward sloping channel on May 11th and continues to trend in a corrective channel lower (red). As fears of the coronavirus in Japan, and at the Olympics in particular, the Nikkei 225 sits over 8.5% off its February 16th highs, oscillating around the 200 Day Moving Average near 27,970. Resistance is at the corrective channel trendline near 29,050 ahead of the February highs at 30,724. If prices can make new local highs, resistance is at the top, upward sloping channel of the longer-term channel. First support below the 200 Day Moving Average is at the bottom channel of the corrective channel, near 26,6700. The next support doesn’t come into play until the 38.2% Fibonacci retracement level from the March 2020 lows to the February 16th highs, near 24,757.

Source: Tradingview, FOREX.com
If the delta variant can be contained at the Olympic games and they proceed without any problems, the Nikkei 225 may get a boost as Japanese corporate sponsors advertising bets will have paid off. However, if the virus spreads around Olympic Village and even worse, athletes need to be sent home, Japan’s main stock market index may be in for a bit of trouble.


